Archive - geneXplain - Page 2

PASS

The acronym PASS stands for Prediction of Activity Spectra for Substances. Using structural formula of a drug-like substance as an input, one obtains its estimated biological activity profile as an output. The predicted biological activity list includes the names of the probable activities with two probabilities: Pa – likelihood of belonging to the class of “Actives” and Pi – likelihood of belonging to the class of “Inactives”. 


By default, all activities with Pa>Pi are considered as probable; however, depending on the particular tasks, the user may choose any other cutoff for selecting the probable “Actives”.

PASS has been well accepted by the research community, and is now actively used in the field of medicinal chemistry, by both academic organizations and pharma companies. There are over 1,200 publications described PASS approach and its applications. Overview on some papers is provided here

Activity prediction for a chemical substance by PASS

The slide show demonstrating the look-and-feel of PASS can be found here as well as on our Facebook site. A particularly useful tool to analyze and utilize PASS results further is PharmaExpert.

Key features of PASS 2022

PASS training set
The general PASS training set was corrected and extended; thus, PASS 2022 SAR Base includes 1,614,066 (1,368,353 in PASS 2020) drugs, drug-candidates, pharmaceutical agents and chemical probes, as well as compounds for which specific toxicity information is known.
Biological activities list
The entire activity list includes 10,112 terms describing biological activities (9,942 in PASS 2020). About two hundred novel biological activities were added including: Antiviral (Coronavirus), Antiviral (SARS coronavirus), 3C-Like protease (SARS coronavirus) inhibitor, Papain-like protease (SARS coronavirus) inhibitor.
Pairwise structure-activity
In PASS 2022 the total number of pairwise structure-activity records is 5,174,855 (4,288,195 in PASS 2020), with an average of 512 compounds per activity and 3.2 activities per compound.
Predictable activity types
The number of predictable activity types is 8,565, and 1,957 activity types are in the recommended activity list. The average invariant accuracy of prediction (IAP) exceeded 0.93 for all 8,565 predictable activities, and is over 0.97 for the recommended activities. Depending on the particular purpose, the user may include into the predictable activity list any of the 8,565 activity types using the “Selection” procedure.

In PASS 2022, the MNA descriptors (for prediction of activity spectra or for adding substances to SAR Base) are generated if structure corresponds to the following criteria:

  • each of the atoms in a molecule must be presented by atom symbol from the periodic table. Symbols of unspecified atom A, Q, *, or R group labels are not allowed;
  • each of the bonds in a molecule must be covalent bond presented by single, double or triple bond types only.

All other limitations on the structural formulae implemented in the previous PASS versions (only one uncharged component, minimum three carbon atoms in the structure, MW<1,250) are not applied anymore.

If the structure does not correspond to these criteria or the input data contains any other errors, a message about the first critical error will be received.

For a multicomponent structure, only the largest component (with the largest number of heavy atoms) is taken into account.

Based on the prediction results, you can evaluate the contribution of each of the atoms of the structure to the estimated biological activity. Select the desired biological activity in the predicted activity spectra by clicking on it; then, each of the atoms of the structure will be colored according to the following scheme:

Light Green   Pa = 1, Pi = 0 (atom promotes activity)

Light Red       Pa = 0, Pi = 1 (atom promotes inactivity)

Light Blue      Pa = 0, Pi = 0 (atom does not generate any signal)

Grey                Pa = 0.33, Pi = 0.33 (atom equivocal for weak signal)

Acyclovir, selected activity – “Antineoplastic enhancer”.


BRENDA

Unique in quality, depth and coverage of the relevant contents.

BRENDA is the most comprehensive information repository on enzymes and enzyme ligand data. The BRENDA enzyme information system has developed into an elaborate system of enzyme and enzyme-ligand information obtained from different sources, combined with flexible query systems and evaluation tools. BRENDA has been developed and is maintained by the Institute of Biochemistry and Bioinformatics at the Technical University of Braunschweig, Germany. Data on enzyme function are extracted manually from primary literature, and are complemented by text and data mining, data integration, and prediction algorithms.
The curation process has been designed to ensure a maximum of quality, depth and coverage of the contents of this unique database. Formal and consistency checks are done by an elaborate computational pipeline. All enzymes in BRENDA are classified according to the biochemical reaction catalyzed, and are assigned to the corresponding Enzyme Commission (EC) numbers. Reaction kinetics are described in detail. BRENDA’s intuitive user interface support a wide range of queries such as fast full text search, advanced complex queries or searching via sequence or substructure. Browsing the contents is facilitated by a Taxonomic Tree, an Enzyme class, a Genome or an Ontology explorer.
Learn more about BRENDA applications and search functions on YouTube.


homepage_brenda_2022.2-720x420

cytochrome-c oxidase catalyzed reaction
The reaction schema of the cytochrome-c oxidase catalyzed reaction.

Structure

The data sources of BRENDA comprise three main domains: Text mining data, manual annotation and external databases and ontologies.
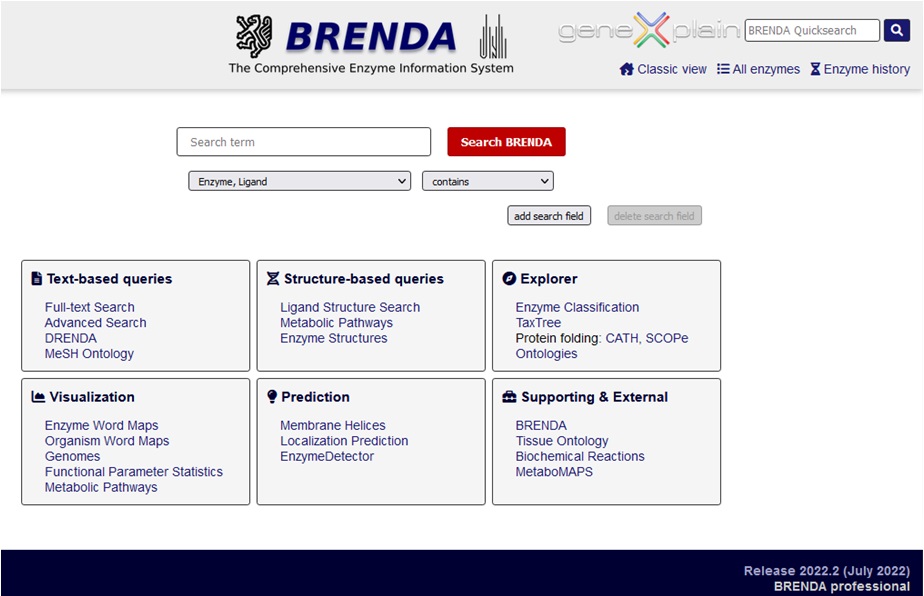
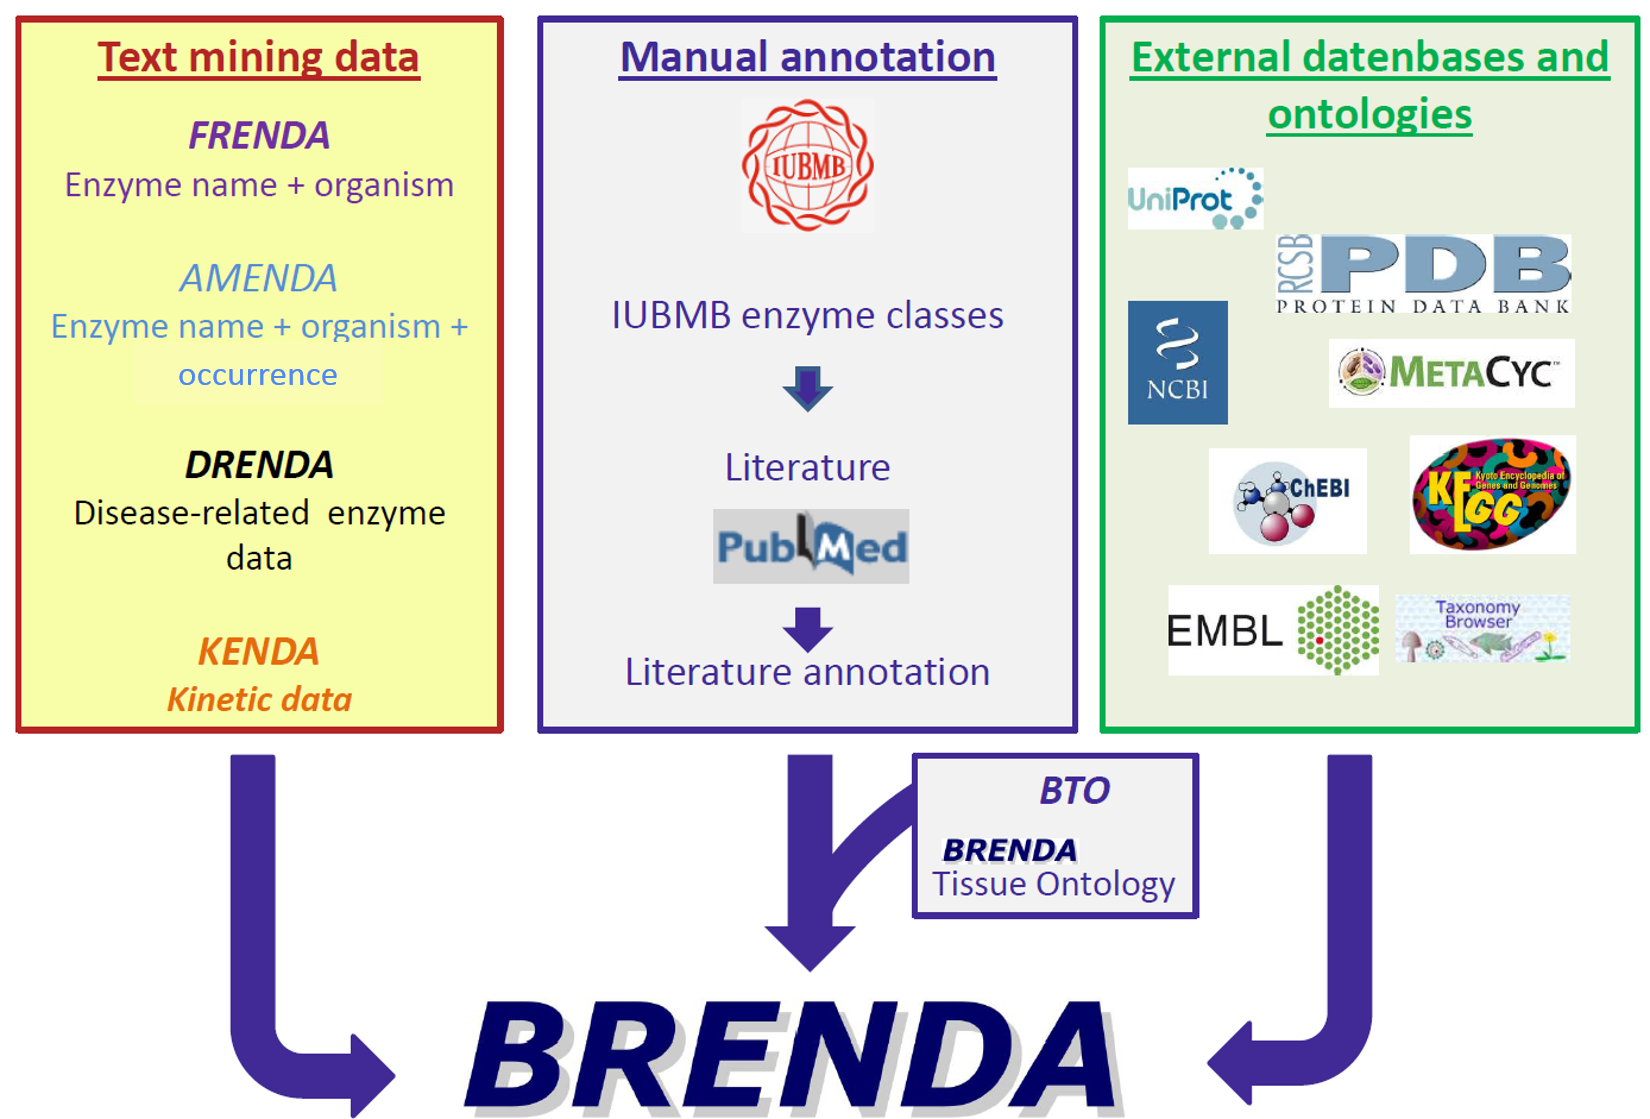
Organization of BRENDA® contents
The supplementary sources FRENDA (enzyme name & organism), AMENDA (enzyme name & organism & occurence), DRENDA (disease-related enzyme data) and KENDA (kinetic data) complement the BRENDA core by text mining data.
The manually annotated core is based on IUBMB enzyme classes and literature from PubMed. Additionally, the BRENDA tissue ontology (BTO) is linked to the manual annotation.
Cross references to several external databases like UniProt, PDB, MetaCyc, ChEBI, KEGG, EMBL, and the Taxonomy Browser of NCBI further expand BRENDA.

Key features

Enzyme and enzyme-ligand information is obtained from different sources, combined with flexible query systems and evaluation tools.
The data are acquired by manual extraction from primary literature, text and data mining, data integration, and prediction algorithms.
The manually derived core contains >3 million data points about >77,000 enzymes annotated from >150,000 publications.
BRENDA comprises molecular data from more than 30,000 organisms.
Each entry is linked to its publication source and the organism of origin. The entries are supplemented by information on occurrence, enzyme / disease relationships from text mining, sequences and 3D structures from other databases, and predicted enzyme location and genome annotation.
The human anatomy atlas CAVEman is linked to the BRENDA Tissue Ontology terms connecting functional enzyme data with their anatomical location.
Word Maps for enzymes generated from PubMed abstracts highlight application and scientific relevance of enzymes.
The EnzymeDetector genome annotation tool and the reaction database BKM-react including reactions from BRENDA, KEGG and MetaCyc.
BRENDA is the most comprehensive information repository on enzymes with 8,149 EC numbers (January 2021).  Thereof  7,787 EC numbers are considered active while others are preliminary or retired and just kept for documentary purpose.
  • SBML output
  • Web-services
  • More detailed statistics can be obtained here.

Benefits

Access the world’s largest manually curated database on enzyme data (>3 million data points annotated).
Experience BRENDA’s intuitive interface, which supports both proteomic beginners and experts in easily retrieving their data of interest.
Take advantage of all the cross-referenced other major databases like KEGG, UniProt, MetaCyc, EMBL, NCBI, and more.
You may install BRENDA on your local Linux or Windows system.
Find at your fingertips essential information from practically all fields of molecular biology, biochemistry, medicine or biotechnology.

Recent applications

Find below a selection of recent articles reporting about BRENDA applications.

Singh, P.K., et al. (2020) Exploring RdRp–remdesivir interactions to screen RdRp inhibitors for the management of novel coronavirus 2019-nCoV. SAR QSAR Environ. Res. 31, 857–867. PubMed

Khurshid, G., et al. (2020) A cyanobacterial photorespiratory bypass model to enhance photosynthesis by rerouting photorespiratory pathway in C3 plants. Sci. Rep. 10, 20879. PubMed

Bartman, C., et al. (2017) Factors influencing the development of visceral metastasis of breast cancer: A retrospective multi-center study. Breast 31, 66-75. PubMed

Brunk, E., et al. (2016) Systems biology of the structural proteome. BMC Syst. Biol. 10, 26. PubMed

Wei, Y., et al. (2015) Insight into Dominant Cellulolytic Bacteria from Two Biogas Digesters and Their Glycoside Hydrolase Genes. PLoS One 10, e0129921. PubMed

Tagore, S., et al. (2014) Analyzing methods for path mining with applications in metabolomics. Gene 534, 125-138. PubMed

Mayer, G., et al. (2014) Controlled vocabularies and ontologies in proteomics: Overview, principles and practice. Biochim. Biophys. Acta 1844, 98-107. PubMed

Ranjan, S., et al. (2013) Computational approach for enzymes present in Capsicum annuum: A review. Int. J. Drug Dev. & Res. 5, 88-97. Link

Publications

A selection of publications authored by the BRENDA team.

Schomburg I., Jeske L., Ulbrich M., Placzek S., Chang A., Schomburg D. (2017) The BRENDA enzyme information system – From a database to an expert system. J. Biotechnol. 261, 194-206. PubMed

Placzek S., Schomburg I., Chang A., Jeske L., Ulbrich M., Tillack J., Schomburg D. (2017) BRENDA in 2017: new perspectives and new tools in BRENDA. Nucleic Acids Res. 45, D380-D388. Oxford

Chang A., Schomburg I., Placzek S., Jeske L., Ulbrich M., Xiao M., Sensen C.W., Schomburg D. (2015) BRENDA in 2015: exciting developments in its 25th year of existence. Nucleic Acids Res. 43, D439-D446. Oxford

Schomburg I., Chang A., Placzek S., Söhngen C., Rother M., Lang M., Munaretto C., Ulas S., Stelzer M., Grote A. Scheer M., Schomburg D. (2013) BRENDA in 2013: integrated reactions, kinetic data, enzyme function data, improved disease classification: new options and contents in BRENDA. Nucleic Acids Res. 41, 764-772. PubMed

Gremse M., Chang A., Schomburg I., Grote A., Scheer M., Ebeling C., Schomburg D.(2011) The BRENDA Tissue Ontology (BTO): the first all-integrating ontology of all organisms for enzyme sources. Nucleic Acids Res. 39, D507-D513. PubMed

Barthelmes J., Ebeling C., Chang A., Schomburg I., Schomburg D. (2007) BRENDA, AMENDA and FRENDA: the enzyme information system in 2007. Nucleic Acids Res. 35, D511-D514. PubMed

Schomburg I., Chang A., Hofmann O., Ebeling C., Ehrentreich F., Schomburg D., (2002) BRENDA: a resource for enzyme data and metabolic information. Trends Biochem. Sci. 27, 54-56. PubMed

Schomburg, I., Chang, A., Schomburg, D., (2002) BRENDA, enzyme data and metabolic information. Nucleic Acids Res. 30, 47-49. PubMed

Schomburg, D., Schomburg, I. (2001) Springer Handbook of Enzymes. 2nd Ed. Springer, Heidelberg. Springer

Schomburg, I., Hofmann, O., Baensch, C., Chang, A., Schomburg, D., (2000) Enzyme data and metabolic information: BRENDA, a resource for research in biology, biochemistry, and medicine. Gene Funct. Dis. 3-4, 109-18.

HumanPSD


The Human Proteome Survey Database (HumanPSDTM) is a catalog of proteins and their complexes from human cells, plus their orthologs from mouse and rat sources.
Its main focus is on the association of human proteins with diseases as well as on their potential use as biomarkers.

Drugs targeting human proteins are reported. In addition, information can be retrieved on the molecular functions, biological roles, localization, and modifications of proteins, expression patterns across cells, tissues, organs, and tumors, consequences of gene mutations in mice, and the physical and regulatory interactions between proteins and genes. HumanPSDTM is available for online access fully integrated with TRANSPATH®.

Picture of HumanPSD

TP53_HumanPSD
Contents of a standard locus report of HumanPSD

Introduction
Description
Synonyms
Biomarker Associations
Diseases associated with MYC
Inherit MYC mutations
Drug Interactions
Drug(s) targeting MYC
Gene Ontology
Molecular function
Biological process
Cellular component
Expression
Tissue expression

Regulation of MYC expression

Mutant Phenotype

Mutant phenotype of closely related homolog(s)

Pathways & interactions
Pathways
Protein-protein interactions
Events acting on MYC
Events triggered by MYC
Transcriptional Regulation
Add a subscription to TRANSFAC® and this report will display additional information
RNA Features
Overview of RNA sequence
Protein Features
Overview of protein sequence and structure
Post-translational modifications of MYC protein
View complex containing MYC protein
Identifiers
Accessions mapped to this record
Annotations
Description
Editor’s Notes
Disease related

Biomarker / disease associations

A tabular summary of literature-derived relationships between human genes and gene products with human diseases is given.
These associations are clearly sorted according to their type, e.g. whether a gene/protein has a causal relationship with a disease to develop, or whether it is merely correlative, etc.

table of diseases associated with MYC

Tabulated summary of disease associations of the human MYC gene.

Key features

Reports
About more than 53,000 proteins and 5390 microRNAs.
Gene-disease assignments
More than 139,800 extracted from original scientific literature and evaluated by experts, referring to more than 3,900 diseases (human) or disease models (mouse).
Drug-protein interactions
More than 55,000 and referring to more than 9,600 drugs.
Gene Ontology (GO)
More than 694,000 assignments to GO, manually annotated and quality-checked.
Gene expression
More than 2,403,000  assignments.
Annotations
More than 2,997,000 annotation statements given.
Peer-reviewed publications
More than 437,000 references to scientific publications provided.
Ontology Browser
An integrated tool supports easy selection of defined sets of gene/molecules.
Functional Analysis
A tool allows identification of shared characteristics in a set of genes/proteins or miRNAs.

Benefits

Quickly access detailed reports
For individual genes, proteins, miRNAs, diseases, and drugs without time-consuming literature search.
Uncover biologically relevant connections
Between seemingly disparate genes, diseases, and drugs.
Identify and rank potential therapeutic targets
Based on known functional characteristics.
Find out clinical trials
For diseases as well as the approved, investigational and experimental drugs and their protein targets.


In addition to that, all our customers enjoy the following advantages or our products:

–       Technical and scientific support or your research: rapid answers to your questions from our professional support team will be always provided

–       Secure cloud space connected with online licenses that can be accessed from any location

–       Extensive manuals, documentation, examples, and tutorials available for all our products

–       Frequent releases and updates of our databases contents and software functionality

–       Ability to request personal training sessions

–       All our servers are running on CO2-neutral water or wind power

Videos

Drug report and pathway report in HumanPSD+TRANSPATH® – this video demonstrates how drug report looks like in the online interface of HumanPSD+TRANSPATH® database. Target molecules, corresponding to a particular drug, are demonstrated, and pathways, in which these molecules are involved, are shown in a very detailed way, with all the underlying reactions, from which the corresponding pathways are constructed. Clinical trials info is also shown for each particular drug and for certain cases even metabolizing enzymes and associated pathways info is also available.

Disease report overview in HumanPSD+TRANSPATH®this video demonstrates how disease report looks like in the online interface of HumanPSD+TRANSPATH® database. Disease biomarkers are shown (genes or proteins or miRNAs) with the type of association and type of indication info. All respective references are demonstrated. Disease similarity maps are also shown (these maps are based on the similarity of different diseases in respect to the common biomarkers that they share).

Disease similarity maps by common biomarkers in HumanPSD+TRANSPATH® – this video shows the overview of disease similarity maps. Common biomarkers of different diseases are displayed on these schemas. The searched disease is placed in the center of the map. The maps have the following color code: diseases sharing common biomarkers are connected with red lines; diseases that have ontological relationships according to the MeSH ontology are connected by gray lines.


Recent applications

Selection of articles reporting about HumanPSD applications:
  • Kawashima Y., Nagai H., Konno R., Ishikawa M., Nakajima D., Sato H., Nakamura R., Furuyashiki T., Ohara O. (2022) Single-Shot 10K Proteome Approach: Over 10,000 Protein Identifications by Data-Independent Acquisition-Based Single-Shot Proteomics with Ion Mobility Spectrometry. J Proteome Res. 21(6), 1418–1427. Link
  • Lim, J. S., Ibaseta, A., Fischer, M. M., Cancilla, B., O’Young, G., Cristea, S., Luca, V. C., Yang, D., Jahchan, N. S., Hamard, C., Antoine, M., Wislez, M., Kong, C., Cain, J., Liu, Y. W., Kapoun, A. M., Garcia, K. C., Hoey, T., Murriel, C. L., & Sage, J. (2017). Intratumoural heterogeneity generated by Notch signalling promotes small-cell lung cancer. Nature, 545(7654), 360–364. Link
  • Reales‐Calderón, J. A., Aguilera‐Montilla, N., Corbí, Á. L., Molero, G., & Gil, C. (2014). Proteomic characterization of human proinflammatory M1 and anti‐inflammatory M2 macrophages and their response to Candida albicans. Proteomics, 14(12), 1503-1518. Link
  • Martínez‐Solano, L., Nombela, C., Molero, G., & Gil, C. (2006). Differential protein expression of murine macrophages upon interaction with Candida albicans. Proteomics, 6(S1), S133-S144. Link

Publications

Selection of publications authored by the geneXplain team:
  • Stelmashenko, D., Kel-Margoulis, O., Apalko, S., & Kel, A. (2022) GENE NETWORKS AND DRUGS. WHAT CAN WE LEARN USING BIO-AND CHEMOINFORMATICS? In XXXVIII Symposium of Bioinformatics and Computer-Aided Drug Discovery (pp. 21-21).
  • Kalya, M., Kel, A., Leha, A., Altynbekova, K., Wingender, E., Beißbarth, T. (2022). Machine Learning based Survival Group Prediction in Glioblastoma. Preprints 2022, 2022020051. Link

Get HumanPSD + TRANSPATH database

TRANSPATH


TRANSPATH® is a database of mammalian signal transduction and metabolic pathways. As one of the earliest pathway databases ever created, it has grown since to the remarkable volume of more than 1,186,000 manually curated reactions. One of the largest pathway databases available, optimally suited for geneXplain’s proprietary Upstream Analysis

Its contents can be used for pathway analysis with the geneXplain platform, requiring separate licensing (see below).

Structure

Reaction hierarchy in the TRANSPATH® database of molecular pathways.

Reaction hierarchy in the TRANSPATH® database on molecular pathways. (Click image for an enlarged view.)

TRANSPATH organizes the information about genes/molecules and reactions according to multiple hierarchies. Its sophisticated structure makes it one of the scientifically best conceptualized pathway resources, suitable for multi-purpose uses. It is complemented by one of the richest corpora of pathway data available among all public domain and commercial sources, all manually curated by experts.

Individual reactions are documented with all experimental details, in a strictly mechanistic way that includes all reaction partners and the taxonomic origin of each molecule as reported in the published experiment (“molecular evidence level”). All evidences for a certain pathway step are accumulated to provide a more comprehensive and complete picture (“pathway step level”). On top, a semantic view is provided, which focuses on the key components only and omits mechanistic details as well as small abundant molecules (“semantic projection”). Complete networks and pathways are built from molecules and their reactions.

To consider the heterogeneity of information given in the original publications, TRANSPATH transparently but precisely differentiates protein molecules according to:

    • their relatedness within one genome
      Information can be specifically retrieved regarding:

(a) specific individual proteins,

(b) all products of a certain gene (isoforms),

(c) different family relation levels (e.g., paralogs);


    • their relatedness between different genomes (orthology)


  • their association and modification status

(a) protein complexes are specified with their exact composition;

(b) post-translational modifications are given with their exact positions in the protein.

TGFbeta network

Visualization of a part of the TGFbeta network with the geneXplain platform; data were retrieved from the TRANSPATH® database. The one molecule of the displayed network that is not genome-encoded (PtdIns(3)P), phosphatidylinositol 3-phosphate) is shown in purple.

Visualization of the TGFbeta network with the geneXplain platform; data were retrieved from the TRANSPATH® database. (Click image to enlarge the picture.)

Key features

Information about pathways
More than 972,000 molecules and more than 111,000 genes involved in signaling or metabolic pathways of mammals (mostly human, mouse, rat), gathered by manual expert curation.
More than one million reactions
Extracted from original scientific literature and evaluated by experts.
Experimentally verified
About 1720 experimentally verified and annotated pathways and chains.
Transcription factor – target gene interactions
More than 98,000, manually annotated and quality-checked.
Peer-reviewed scientific publications
More than 75,000 publications evaluated.
Pathway visualization tool
Highly customizable view of pathways and networks under the geneXplain platform.

Benefits

Quickly access information
About signal transduction and metabolic pathway components and their reactions without tedious and time consuming literature searches.
Predict potential pathways
Targeting the genes of your interest.
Build customized regulatory and metabolic networks
With more than one million reactions extracted from original scientific literature and evaluated by experts.
Use network visualization
With advanced TRANSPATH®-based technology of the geneXplain platform.


In addition to that, all our customers enjoy the following advantages or our products:

–       Technical and scientific support or your research: rapid answers to your questions from our professional support team will be always provided

–       Secure cloud space connected with online licenses that can be accessed from any location

–       Extensive manuals, documentation, examples, and tutorials available for all our products

–       Frequent releases and updates of our databases contents and software functionality

–       Ability to request personal training sessions

–       All our servers are running on CO2-neutral water or wind power

Pathway analysis

Get a picture of TRANSPATH®

Pathway analysis and network visualization with the geneXplain platform using the TRANSPATH® database.

Pathway analysis and network visualization with the geneXplain platform using the TRANSPATH® database. (Click image to enlarge the picture.)

Learn more about pathway analysis with the geneXplain platform.

Recent applications

Selection of articles reporting about TRANSPATH applications:
  • Rajavel A., Klees S., Hui Y., Schmitt A.O., Gültas M. (2022) Deciphering the Molecular Mechanism Underlying African Animal Trypanosomiasis by Means of the 1000 Bull Genomes Project Genomic Dataset. Biology (Basel). 11(5), 742. Link
  • Menck K., Wlochowitz D., Wachter A., Conradi L.C., Wolff A., Scheel A.H., Korf U., Wiemann S., Schildhaus H.U., Bohnenberger H., Wingender E., Pukrop T., Homayounfar K., Beißbarth T., Bleckmann A. (2022) High-Throughput Profiling of Colorectal Cancer Liver Metastases Reveals Intra- and Inter-Patient Heterogeneity in the EGFR and WNT Pathways Associated with Clinical Outcome. Cancers 14(9), 2084. Link
  • Kechin A.A., Ivanov A.A., Kel A.E., Kalmykov A.S., Oskorbin I.P., Boyarskikh U.A., Kharpov E.A., Bakharev S.Y., Oskina N.A., Samuilenkova O.V., Vikhlyanov I.V., Kushlinskii N.E., Filipenko M.L. (2022) Prediction of EVT6-NTRK3-Dependent Papillary Thyroid Cancer Using Minor Expression Profile. Bull Exp Biol Med. 173(2),252-256. Link
  • Myer, P. A., Kim, H., Blümel, A. M., Finnegan, E., Kel, A., Thompson, T. V., Greally, J. M., Prehn, J. H., O’Connor, D. P., Friedman, R. A., Floratos, A., & Das, S. (2022). Master Transcription Regulators and Transcription Factors Regulate Immune-Associated Differences Between Patients of African and European Ancestry With Colorectal Cancer. Gastro Hep Adv. 1(3),328-341. Link
  • Chereda, H., Bleckmann, A., Menck, K., Perera-Bel, J., Stegmaier, P., Auer, F., Kramer, F., Leha, A., & Beißbarth, T. (2021). Explaining decisions of graph convolutional neural networks: patient-specific molecular subnetworks responsible for metastasis prediction in breast cancer. Genome Med. 13(1),42. Link
  • Kalya M., Kel A., Wlochowitz D., Wingender E., Beißbarth T. (2021) IGFBP2 Is a Potential Master Regulator Driving the Dysregulated Gene Network Responsible for Short Survival in Glioblastoma Multiforme. Front Genet. 12, 670240. Link
  • Benjamin, S.J., Hawley, K.L., Vera-Licona, P., La Vake, C.J., Cervantes, J.L., Ruan, Y., Radolf, J.D., Salazar, J.C. (2021) Macrophage mediated recognition and clearance of Borrelia burgdorferi elicits MyD88-dependent and -independent phagosomal signals that contribute to phagocytosis and inflammation. BMC Immunol. 22, 32. Link
  • Ivanov, S., Filimonov, D., & Tarasova, O. (2021) A computational analysis of transcriptional profiles from CD8(+) T lymphocytes reveals potential mechanisms of HIV/AIDS control and progression. Comput Struct Biotechnol J. 19, 2447–2459. Link
  • Meier, T., Timm, M., Montani, M., Wilkens, L. (2021) Gene networks and transcriptional regulators associated with liver cancer development and progression. BMC Med. Genomics 14, 41. Link
  • Lloyd K., Papoutsopoulou S., Smith E., Stegmaier P., Bergey F., Morris L., Kittner M., England H., Spiller D., White M.H.R., Duckworth C.A., Campbell B.J., Poroikov V., Martins Dos Santos V.A.P., Kel A., Muller W., Pritchard D.M., Probert C., Burkitt M.D.; SysmedIBD Consortium. Using systems medicine to identify a therapeutic agent with potential for repurposing in inflammatory bowel disease. Dis Model Mech. 13(11), dmm044040. Link
  • Ramzan, F., Klees, S., Schmitt, A. O., Cavero, D., & Gültas, M. (2020) Identification of Age-Specific and Common Key Regulatory Mechanisms Governing Eggshell Strength in Chicken Using Random Forests. Genes (Basel). 11(4), 464. Link
  • Ayyildiz D., Antoniali G., D’Ambrosio C., Mangiapane G., Dalla E., Scaloni A., Tell G., Piazza S. (2020) Architecture of The Human Ape1 Interactome Defines Novel Cancers Signatures. Sci Rep. 10, 28. Link
  • Mekonnen, Y.A., Gültas, M., Effa, K., Hanotte, O., Schmitt, A.O. (2019) Identification of Candidate Signature Genes and Key Regulators Associated With Trypanotolerance in the Sheko Breed. Front. Genet. 10, 1095. Link
  • Nobis, C. C., Dubeau Laramée, G., Kervezee, L., Maurice De Sousa, D., Labrecque, N., & Cermakian, N. (2019) The circadian clock of CD8 T cells modulates their early response to vaccination and the rhythmicity of related signaling pathways. Proc Natl Acad Sci U S A. 116(40), 20077–20086. Link
  • Orekhov A.N., Oishi Y., Nikiforov N.G., Zhelankin A.V., Dubrovsky L., Sobenin I.A., Kel A., Stelmashenko D., Makeev V.J., Foxx K., Jin X., Kruth H.S., Bukrinsky M. (2018) Modified LDL Particles Activate Inflammatory Pathways in Monocyte-derived Macrophages: Transcriptome Analysis. Curr Pharm Des. 24(26),3143-3151. Link
  • Wlochowitz, D., Haubrock, M., Arackal, J., Bleckmann, A., Wolff, A., Beißbarth, T., Wingender, E., Gültas, M. (2016) Computational Identification of Key Regulators in Two Different Colorectal Cancer Cell Lines. Front. Genet. 7, 42. Link
  • Kural, K.C., Tandon, N., Skoblov, M., Kel-Margoulis, O.V. and Baranova, A.V. (2016) Pathways of aging: comparative analysis of gene signatures in replicative senescence and stress induced premature senescence. BMC Genomics 17(Suppl 14), 1030. Link
  • Malusa, F., Taranta, M., Zaki, N., Cinti, C., & Capobianco, E. (2015) Time-course gene profiling and networks in demethylated retinoblastoma cell line. Oncotarget. 6(27), 23688–23707. Link
  • Kutumova E.O., Kiselev I.N., Sharipov R.N., Lavrik I.N., Kolpakov F.A. (2012) A modular model of the apoptosis machinery. Adv Exp Med Biol. 736, 235-45. Link
  • Schuler, M., Keller, A., Backes, C., Philippar, K., Lenhof, H. P., & Bauer, P. (2011) Transcriptome analysis by GeneTrail revealed regulation of functional categories in response to alterations of iron homeostasis in Arabidopsis thaliana. BMC Plant Biol. 11, 87. Link
  • Ante M., Wingender E., Fuchs M. (2011) Integration of gene expression data with prior knowledge for network analysis and validation. BMC Res Notes. 4,520. Link
  • Chiu SC, Tsao SW, Hwang PI, Vanisree S, Chen YA, Yang NS. (2010) Differential functional genomic effects of anti-inflammatory phytocompounds on immune signaling. BMC Genomics. 11, 513. Link

Publications

Selection of publications authored by the geneXplain team:
  • Kisakol, B., Matveeva, A., Salvucci, M., Kel, A., McDonough, E., Ginty, F., Longley, D., Prehn, J. (2024) Identification of unique rectal cancer-specific subtypes. Br J Cancer. DOI https://doi.org/10.1038/s41416-024-02656-0. Link
  • Kolpakov, F., Akberdin, I., Kiselev, I., Kolmykov, S., Kondrakhin, Y., Kulyashov, M., Kutumova, E., Pintus, S., Ryabova, A., Sharipov, R., Yevshin, I., Zhatchenko, S., & Kel, A. (2022). BioUML-towards a universal research platform. Nucleic Acids Res. 50(W1),W124–31. Link
  • Orekhov A.N., Sukhorukov V.N., Nikiforov N.G., Kubekina M.V., Sobenin I.A., Foxx K.K., Pintus S., Stegmaier P., Stelmashenko D., Kel A., Poznyak A.V., Wu W.K., Kasianov A.S., Makeev V.Y., Manabe I., Oishi Y. (2020) Signaling Pathways Potentially Responsible for Foam Cell Formation: Cholesterol Accumulation or Inflammatory Response-What is First? Int J Mol Sci. 21(8),2716. Link
  • Kel A., Boyarskikh U., Stegmaier P., Leskov L.S., Sokolov A.V., Yevshin I., Mandrik N., Stelmashenko D., Koschmann J., Kel-Margoulis O., Krull M., Martínez-Cardús A., Moran S., Esteller M., Kolpakov F., Filipenko M., Wingender E. (2019) Walking pathways with positive feedback loops reveal DNA methylation biomarkers of colorectal cancer. BMC Bioinformatics. 20(Suppl 4),119. Link
  • Boyarskikh, U., Pintus, S., Mandrik, N., Stelmashenko, D., Kiselev, I., Evshin, I., Sharipov, R., Stegmaier, P., Kolpakov, F., Filipenko, M., Kel, A. (2018) Computational master-regulator search reveals mTOR and PI3K pathways responsible for low sensitivity of NCI-H292 and A427 lung cancer cell lines to cytotoxic action of p53 activator Nutlin-3. BMC Med. Genomics 11(Suppl 1), 12. Link
  • Kel, A.E., Stegmaier, P., Valeev, T., Koschmann, J., Poroikov, V., Kel-Margoulis, O.V. and Wingender, E. (2016) Multi-omics “upstream analysis” of regulatory genomic regions helps identifying targets against methotrexate resistance of colon cancer. EuPA Open Proteomics 13, 1-13. Link

Get HumanPSD + TRANSPATH

What is Pathway Analysis?

This may have different flavors:

Therefore, the geneXplain platform provides an empirical way to identify the specific combination of sites that characterizes a given set of co-regulating promoters.

Most commonly, it is of interest to know which signaling or metabolic pathways are activated under certain experimental conditions.

A slightly different question may be to find out which pathways were used to express a certain observed phenotype.

Both types of problems can be conveniently addressed with the geneXplain platform.

Approaches to pathway analysis

To find out whether among all genes induced in an experiment those are overrepresented that encode components of a certain pathway, conventional gene set enrichment analysis (GSEA) and related methods can be applied. In such an approach, however, topological information about the pathway is lost.

More sophisticated is to search for those networks, pathways or paths where many linked components have been induced. This is provided by the platform option “Cluster by shortest path”. A visualization of differential expression onto a known pathway is shown in the figure below. These known pathways may be documented in the databases TRANSPATH® (manually curated information; example shown) or GeneWays (compiled by text mining).

Learn more about the geneXplain platform.

Click image for an enlarged view of the visualization of the clustered paths comprising a maximal number of differentially expressed genes, highlighted by a customizable color code between most significantly down- (blue) or up-regulated (orange) genes in two different experiments (left/right half of the colored boxes around the gene names). Edge labels indicate the number of steps between the shown nodes. In this example, mapping was done onto the GeneWays database network.

When starting from a set of differentially expressed genes or their products, resp., it is frequently of interest to see what is their common activator. Such convergence points of upstream pathways are potential master regulators, or key nodes.

The next figure shows how the upstream paths of a set of proteins (blue) converge in one master regulator (here: AKT1, red). The database behind this analysis is TRANSPATH®. It can be seen how a section of the whole pathway (overview in the lower right window) is amenable to editing in the main work area. Detailed information about a selected component, like the mTor complex in this example, are displayed in the Info Box at the lower left corner.

Click image for an enlarged view.

This type of analysis can be combined with the visualization of differentially expressed genes and their expression behavior, in the same way as shown above.

Click for an enlarged view of the customizable interface.
Click image for the complete view of the exported network picture.

Graph layout

Proper handling of the layout is a particular challenge when displaying networks. The implementation in the geneXplain platform ensures an easy and fast reorganization of the layout between a hierarchical, force-directed and orthogonal layout scheme.

Click image for an enlarged view either of the hierarchical, the force-directed or the orthogonal layout.

Graph search

Any diagram constructed from TRANSPATH or GeneWays contents can be manually expanded to molecules that are connected to a selected node (see figure below). Subsequent automatic redesign will refine the appearance of the graph according to the chosen layout style.

graph_search-2

Click image for an enlarged view of the original small network with IL-10 as key node, the network expanded for further IL-10 targets, and the re-arranged visualization after re-arranged, force-directed layout.

Joining graphs

Several diagrams, e.g. pointing at different master regulators (figure below, red nodes), can be easily joined.

Click image for an enlarged view of the “join diagrams” option, or the resulting joined network.

geneXplain platform

The comprehensive bioinformatics platform, also available via API


The geneXplain platform is an online toolbox and workflow management system for a broad range of bioinformatic and systems biology applications. The individual modules, or Bricks, are unified under a standardized interface, with a consistent look-and-feel and can flexibly be put together to comprehensive workflows. The workflow management is intuitively handled through a simple drag-and-drop system. With this system, you can edit the predefined workflows or compose your own workflows from scratch.


Own Bricks can easily be added as scripts or plug-ins and can be used in combination with pre-existing analyses.
GeneXplain GmbH provides a number of state-of-the-art bricks; some of them can be obtained free of charge, while others require licensing for small fee in order to guarantee active maintenance and dynamic adaptation to the rapidly developing know-how in this field.

geneXplain platform appearance

The start page provides an easy access to a number of application areas.

Key features

Integrated AI and ML tools for TFBS prediction
The platform provides access to advanced tools for prediction of genomic transcription factor (TF) binding sites and composite regulatory regions using such algorithms of Machine Learning (ML) and Artificial Intelligence (AI) as Genetic Algorithms and Sparse Logistic Regression.
Integrated databases and analysis tools
The platform provides an integrated view on several databases and analysis tools, public domain as well as commercial ones. They can be combined in a highly flexible way to design customized analyses.
Ready-made workflows for an easy start
A rapidly growing number of proven workflows facilitates a quick and easy access to the platform and its complex analysis functions. Input forms are simple and user-friendly. Workflows can be easily customized to specific needs. Experienced users can create their own workflows.
Fully integrated upstream analysis
The platform provides a fully integrated upstream analysis, which combines state-of-the-art analysis of regulatory genome regions with sophisticated pathway analyses.
Knowledge-based data analysis
The platform uses a number of renowned high-quality databases for the data analysis. TRANSFAC® and TRANSPATH® are expert-curated databases. GeneWays is generated by an NLP-based text-mining approach, providing a helpful complement for manually curated data. Well-known public-domain databases like Reactome and HumanCyc are integrated and applied as well.
JavaScript and R scripts
User-specific scripts in JavaScript and in R can be added directly into the platform, and immediately executed. They can be combined with pre-existing analyses, and can be part of the workflows.
NGS data analysis
NGS data analysis is supported by the platform. ChIP-seq data sets containing in vivo transcription factor binding sites or methylation results can be analyzed with the help of ready-made workflows. Galaxy tools are integrated, supporting RNA-seq data analysis, and many functions more.
Simulation engine inside
The platform contains a simulation engine that executes differential equation systems and visualizes the results. Parameter optimization, parameter fitting (based on expression data), and hierarchical modeling are supported.
Group project work including chat function
Share your data and results with other members of the project. Discuss what you are doing while working together on a dataset.


In addition to that, all our customers enjoy the following advantages or our products:

–       Technical and scientific support or your research: rapid answers to your questions from our professional support team will be always provided

–       Secure cloud space connected with online licenses that can be accessed from any location

–       Extensive manuals, documentation, examples, and tutorials available for all our products

–       Frequent releases and updates of our databases contents and software functionality

–       Ability to request personal training sessions

–       All our servers are running on CO2-neutral water or wind power

Insights

RNA-seq data analysis
From raw reads to full integrated & advanced gene analysis of your experimental data.
Transcription factor identification
Find enriched transcription factor binding sites and corresponding factors/enhancers.
Networks and key signaling molecules
Upstream analysis to discover novel master regulators and underlying mechanisms.
Next generation sequencing
Gene expression profiling, detection of genetics changes and molecular analysis.
Drug target assessment
Integrated promoter and pathway analysis to find prospective therapeutic targets.
Pathway enrichment
Identify key nodes and inferred activity in canonical pathways or reconstructed networks.
ChIP-seq data analysis
Calling peaks, find regulatory regions, classify and analyze target genes.
Single Nucleotide Polymorphisms
Identify affected regulatory DNA motifs and find damaged signal proteins.
Gene Ontology
Map, reduce and visualize GO terms to get a functional classification.
Single Sequences in Genome browser
Work with human, mouse, rat, zebrafish and arabidopsis genome builds.
miRNA characterization
Target identification, get binding site enrichment and tissue specificity.
Genomic variants verification
Predict variant effects and get a molecular tumor board report.

New applications

Out now !
Updated databases
  • TRANSFAC® 2023.2
  • TRANSPATH® 2023.2
  • HumanPSD™ 2023.2
Gene regulatory networks construction via API
  • New Jupyter notebook Python sample code that allows construction of gene regulatory networks using the geneXplain platform API can be viewed from Colab notebook or downloaded from here.


Videos

Here are videos about “RNA-seq preprocessing with the geneXplain platform”
Here is a playlist about “RNA-seq data analysis from FASTQ files to master regulators with geneXplain platform”
Find below a compilation of our introductory and tutorial videos
In English Language
This video is a general introduction to the geneXplain® platform. (3:21 min)
This video is about how to convert gene identifiers from Ensembl to others in the geneXplain platform. (3:02 min)
This video is about how to annotate a gene table with the geneXplain platform. (2:57 min)
In Chinese Language
This video is a general introduction to the geneXplain® platform; it introduces you to different workflows. (1:38 min)
It shows you how to register a free platform account and to login. The audio-visual also introduces you to the look and feel of the geneXplain® platform interface. (4:11 min)
This video demonstrates how to upload raw data from an experiment to the geneXplain® platform for further analysis. (2:46 min)
In this video microarray data is used as an example to show you how to further analyze data from high-throughput experiments on the geneXplain® platform. (6:45 min)

Examples

Any user of the geneXplain platform can view the free examples demonstrating the platform abilities towards processing various types of multi-omics data in different studied biological processes and pathologies.

The Examples are located in the Data tab of the geneXplain platform interface under the Examples folder:

Examples of the geneXplain platform

Description of each example is available in the info box upon the click on the name of the respective project:

geneXplain platform example- COVID -19 suppress innate immune responses GSE156063, Illumina high throughput sequencing

(Click on the image to see it in the full screen mode)

Publications

Selection of geneXplain platform citations by third-party researchers:
  • Drake, C., Zobl W., Wehr M., Koschmann J., De Luca D., Kühne B. A. , Vrieling H. , Boei J. , Hansen T. , Escher S. E. (2023) Substantiate a read-across hypothesis by using transcriptome data—A case study on volatile diketones. Front. Toxicol. 5Link
  • Rajavel A., Klees S., Hui Y., Schmitt A.O., Gültas M. (2022) Deciphering the Molecular Mechanism Underlying African Animal Trypanosomiasis by Means of the 1000 Bull Genomes Project Genomic Dataset. Biology (Basel). 11(5), 742. Link
  • Menck K., Wlochowitz D., Wachter A., Conradi L.C., Wolff A., Scheel A.H., Korf U., Wiemann S., Schildhaus H.U., Bohnenberger H., Wingender E., Pukrop T., Homayounfar K., Beißbarth T., Bleckmann A. (2022) High-Throughput Profiling of Colorectal Cancer Liver Metastases Reveals Intra- and Inter-Patient Heterogeneity in the EGFR and WNT Pathways Associated with Clinical Outcome. Cancers 14(9), 2084. Link
  • Myer P.A., Kim H., Blümel A.M., Finnegan E., Kel A., Thompson T.V., Greally J.M., Prehn J.H., O’Connor D.P., Friedman R.A., Floratos A., Das S. (2022) Master Transcription Regulators and Transcription Factors Regulate Immune-Associated Differences Between Patients of African and European Ancestry With Colorectal Cancer. Gastro Hep Adv. 1(3), 328–341. Link
  • Kawashima Y., Nagai H., Konno R., Ishikawa M., Nakajima D., Sato H., Nakamura R., Furuyashiki T., Ohara O. (2022) Single-Shot 10K Proteome Approach: Over 10,000 Protein Identifications by Data-Independent Acquisition-Based Single-Shot Proteomics with Ion Mobility Spectrometry. J Proteome Res. 21(6), 1418–1427. Link
  • Klees S., Schlüter J.S., Schellhorn J., Bertram H., Kurzweg A.C., Ramzan F., Schmitt A.O., Gültas M. (2022) Comparative Investigation of Gene Regulatory Processes Underlying Avian Influenza Viruses in Chicken and Duck. Biology (Basel). 11(2), 219. Link
  • Benjamin, S.J., Hawley, K.L., Vera-Licona, P., La Vake, C.J., Cervantes, J.L., Ruan, Y., Radolf, J.D., Salazar, J.C. (2021) Macrophage mediated recognition and clearance of Borrelia burgdorferi elicits MyD88-dependent and -independent phagosomal signals that contribute to phagocytosis and inflammation. BMC Immunol. 22, 32. Link
  • Menck K., Heinrichs S., Wlochowitz D., Sitte M., Noeding H., Janshoff A., Treiber H., Ruhwedel T., Schatlo B., von der Brelie C., Wiemann S., Pukrop T., Beißbarth T., Binder C., Bleckmann A. (2021) WNT11/ROR2 signaling is associated with tumor invasion and poor survival in breast cancer. J Exp Clin Cancer Res. 40, 395. Link
  • Meier, T., Timm, M., Montani, M., Wilkens, L. (2021) Gene networks and transcriptional regulators associated with liver cancer development and progression. BMC Med. Genomics 14, 41. Link
  • Chereda H., Bleckmann A., Menck K., Perera-Bel J., Stegmaier P., Auer F., Kramer F., Leha A., Beißbarth T. (2021) Explaining decisions of graph convolutional neural networks: patient-specific molecular subnetworks responsible for metastasis prediction in breast cancer. Genome Med. 13, 42. Link
  • Heinrich F., Ramzan F., Rajavel A., Schmitt A.O., Gültas M. (2021) MIDESP: Mutual Information-Based Detection of Epistatic SNP Pairs for Qualitative and Quantitative Phenotypes. Biology (Basel). 10(9), 921. Link
  • Tenesaca S., Vasquez M., Alvarez M., Otano I., Fernandez-Sendin M., Di Trani C.A., Ardaiz N., Gomar C., Bella A., Aranda F., Medina-Echeverz J., Melero I., Berraondo P. (2021) Statins act as transient type I interferon inhibitors to enable the antitumor activity of modified vaccinia Ankara viral vectors. J Immunother Cancer. 9(7), e001587. Link
  • Vanvanhossou S.F.U., Giambra I.J., Yin T., Brügemann K., Dossa L.H., König S. (2021) First DNA Sequencing in Beninese Indigenous Cattle Breeds Captures New Milk Protein Variants. Genes (Basel). 12(11), 1702. Link
  • Lloyd K., Papoutsopoulou S., Smith E., Stegmaier P., Bergey F., Morris L., Kittner M., England H., Spiller D., White M.H.R., Duckworth C.A., Campbell B.J., Poroikov V., Martins Dos Santos V.A.P., Kel A., Muller W., Pritchard D.M., Probert C., Burkitt M.D.; SysmedIBD Consortium. Using systems medicine to identify a therapeutic agent with potential for repurposing in inflammatory bowel disease. Dis Model Mech. 13(11), dmm044040. Link
  • Odagiu L., Boulet S., Maurice De Sousa D., Daudelin J.F., Nicolas S., Labrecque N. (2020) Early programming of CD8+ T cell response by the orphan nuclear receptor NR4A3. Proc Natl Acad Sci U S A. 117(39), 24392–24402. Link
  • Ayyildiz D., Antoniali G., D’Ambrosio C., Mangiapane G., Dalla E., Scaloni A., Tell G., Piazza S. (2020) Architecture of The Human Ape1 Interactome Defines Novel Cancers Signatures. Sci Rep. 10, 28. Link
  • Ural, B.B., Yeung, S.T., Damani-Yokota, P., Devlin, J.C., de Vries, M., Vera-Licona, P., Samji, T., Sawai, C.M., Jang, G., Perez, O.A., Pham, Q., Maher, L., Loke, P., Dittmann, M., Reizis, B., Khanna, K.M. (2020) Identification of a nerve-associated, lung-resident interstitial macrophage subset with distinct localization and immunoregulatory properties. Sci. Immunol. 5, eaax8756. Link
  • Leiherer A., Muendlein A., Saely C.H., Fraunberger P., Drexel H. (2019) Serotonin is elevated in risk-genotype carriers of TCF7L2 – rs7903146. Sci Rep. 9, 12863. Link
  • Wang B., Ran Z., Liu M., Ou Y. (2019) Prognostic Significance of Potential Immune Checkpoint Member HHLA2 in Human Tumors: A Comprehensive Analysis. Front Immunol. 10, 1573. Link
  • Mekonnen, Y.A., Gültas, M., Effa, K., Hanotte, O., Schmitt, A.O. (2019) Identification of Candidate Signature Genes and Key Regulators Associated With Trypanotolerance in the Sheko Breed. Front. Genet. 10, 1095. Link
  • Blazquez, R., Wlochowitz, D., Wolff, A., Seitz, S., Wachter, A., Perera-Bel, J., Bleckmann, A., Beißbarth, T., Salinas, G., Riemenschneider, M.J., Proescholdt, M., Evert, M., Utpatel, K., Siam, L., Schatlo, B., Balkenhol, M., Stadelmann, C., Schildhaus, H.U., Korf, U., Reinz, E., Wiemann, S., Vollmer, E., Schulz, M., Ritter, U., Hanisch, U.K., Pukrop, T. (2018) PI3K: A master regulator of brain metastasis-promoting macrophages/microglia. Glia 66, 2438-2455. Link
  • Orekhov, A.N., Oishi, Y., Nikiforov, N.G., Zhelankin, A.V., Dubrovsky, L., Sobenin, I.A., Kel, A., Stelmashenko, D., Makeev, V.J., Foxx, K., Jin, X., Kruth, H.S. Bukrinsky, M. (2018) Modified LDL Particles Activate Inflammatory Pathways in Monocyte-derived Macrophages: Transcriptome Analysis. Curr. Pharm. Des. 24, 3143-3151. Link
  • Smetanina, M.A., Kel, A.E., Sevost’ianova, K.S., Maiborodin, I.V., Shevela, A.I., Zolotukhin, I.A., Stegmaier, P., Filipenko, M.L. (2018) DNA methylation and gene expression profiling reveal MFAP5 as a regulatory driver of extracellular matrix remodeling in varicose vein disease. Epigenomics 10, 1103-1119. Link
  • Kalozoumi, G., Kel-Margoulis, O., Vafiadaki, E., Greenberg, D., Bernard, H., Soreq, H., Depaulis, A., Sanoudou, D. (2018) Glial responses during epileptogenesis in Mus musculus point to potential therapeutic targets. PLoS One 13, e0201742. Link
  • Mandić, A.D., Bennek, E., Verdier, J., Zhang, K., Roubrocks, S., Davis, R.J., Denecke, B., Gassler, N., Streetz, K., Kel, A., Hornef, M., Cubero, F. J., Trautwein, C. and Sellge, G. (2017) c-Jun N-terminal kinase 2 promotes enterocyte survival and goblet cell differentiation in the inflamed intestine. Mucosal Immunol. 10, 1211-1223. Link
  • Niehof, M., Hildebrandt, T., Danov, O., Arndt, K., Koschmann, J., Dahlmann, F., Hansen, T. and Sewald, K. (2017) RNA isolation from precision-cut lung slices (PCLS) from different species. BMC Res. Notes 10, 121. Link
  • Triska, M., Solovyev, V., Baranova, A., Kel, A., Tatarinova, T.V. (2017) Nucleotide patterns aiding in prediction of eukaryotic promoters. PLoS One 12, e0187243. Link
  • Pietrzyńska, M., Zembrzuska, J., Tomczak, R., Mikołajczyk, J., Rusińska-Roszak, D., Voelkel, A., Buchwald, T., Jampílek, J., Lukáč, M., Devínsky, F. (2016) Experimental and in silico investigations of organic phosphates and phosphonates sorption on polymer-ceramic monolithic materials and hydroxyapatite. Eur. J. Pharm. Sci. 93, 295-303. Link
  • Ciribilli, Y., Singh, P., Inga, A., Borlak, J. (2016) c-Myc targeted regulators of cell metabolism in a transgenic mouse model of papillary lung adenocarcinoma. Oncotarget 7, 65514-65539. Link
  • Wlochowitz, D., Haubrock, M., Arackal, J., Bleckmann, A., Wolff, A., Beißbarth, T., Wingender, E., Gültas, M. (2016) Computational Identification of Key Regulators in Two Different Colorectal Cancer Cell Lines. Front. Genet. 7, 42. Link
  • Lee, E.H., Oh, J.H., Selvaraj, S., Park, S.M., Choi, M.S., Spanel, R., Yoon, S. and Borlak, J. (2016) Immunogenomics reveal molecular circuits of diclofenac induced liver injury in mice. Oncotarget 7, 14983-15017. Link
  • Kural, K.C., Tandon, N., Skoblov, M., Kel-Margoulis, O.V. and Baranova, A.V. (2016) Pathways of aging: comparative analysis of gene signatures in replicative senescence and stress induced premature senescence. BMC Genomics 17(Suppl 14), 1030. Link
  • Borlak, J., Singh, P. and Gazzana, G. (2015) Proteome mapping of epidermal growth factor induced hepatocellular carcinomas identifies novel cell metabolism targets and mitogen activated protein kinase signalling events. BMC Genomics 16, 124. Link
  • Shi, Y., Nikulenkov, F., Zawacka-Pankau, J., Li, H., Gabdoulline, R., Xu, J., Eriksson, S., Hedström, E., Issaeva, N., Kel, A., Arnér, E.S., Selivanova, G. (2014) ROS-dependent activation of JNK converts p53 into an efficient inhibitor of oncogenes leading to robust apoptosis. Cell Death Differ. 21, 612-623. Link
  • Schlereth, K., Heyl, C., Krampitz, A.M., Mernberger, M., Finkernagel, F., Scharfe, M., Jarek, M., Leich, E., Rosenwald, A., Stiewe, T. (2013) Characterization of the p53 Cistrome – DNA Binding Cooperativity Dissects p53’s Tumor Suppressor Functions. PLoS Genet. 9, e1003726. Link
  • Nikulenkov, F., Spinnler, C., Li, H., Tonelli, C., Shi, Y., Turunen, M., Kivioja, T., Ignatiev, I., Kel, A., Taipale, J., Selivanova, G. (2012) Insights into p53 transcriptional function via genome-wide chromatin occupancy and gene expression analysis. Cell Death Differ. 19, 1992-2002. Link
  • Zawacka-Pankau, J., Grinkevich, V.V., Hunten, S., Nikulenkov, F., Gluch, A., Li, H., Enge, M., Kel, A., Selivanova, G. (2011) Inhibition of glycolytic enzymes mediated by pharmacologically activated p53: targeting Warburg effect to fight cancer. J. Biol. Chem. 286, 41600-41615. Link
Selection of publications authored by the geneXplain team:
  • Kisakol, B., Matveeva, A., Salvucci, M., Kel, A., McDonough, E., Ginty, F., Longley, D., Prehn, J. (2024) Identification of unique rectal cancer-specific subtypes. Br J Cancer. DOI https://doi.org/10.1038/s41416-024-02656-0. Link
  • Kalya M., Kel A., Wlochowitz D., Wingender E., Beißbarth T. (2021) IGFBP2 Is a Potential Master Regulator Driving the Dysregulated Gene Network Responsible for Short Survival in Glioblastoma Multiforme. Front Genet. 12, 670240. Link
  • Alachram H., Chereda H., Beißbarth T., Wingender E., Stegmaier P. (2021) Text mining-based word representations for biomedical data analysis and protein-protein interaction networks in machine learning tasks. PLoS One., 16(10), e0258623. Link
  • Kel A., Boyarskikh U., Stegmaier P., Leskov L.S., Sokolov A.V., Yevshin I., Mandrik N., Stelmashenko D., Koschmann J., Kel-Margoulis O., Krull M., Martínez-Cardús A., Moran S., Esteller M., Kolpakov F., Filipenko M., Wingender E. (2019) Walking pathways with positive feedback loops reveal DNA methylation biomarkers of colorectal cancer. BMC Bioinformatics. 20(Suppl 4),119. Link
  • Boyarskikh, U., Pintus, S., Mandrik, N., Stelmashenko, D., Kiselev, I., Evshin, I., Sharipov, R., Stegmaier, P., Kolpakov, F., Filipenko, M., Kel, A. (2018) Computational master-regulator search reveals mTOR and PI3K pathways responsible for low sensitivity of NCI-H292 and A427 lung cancer cell lines to cytotoxic action of p53 activator Nutlin-3. BMC Med. Genomics 11(Suppl 1), 12. Link
  • Kel, A.E., Stegmaier, P., Valeev, T., Koschmann, J., Poroikov, V., Kel-Margoulis, O.V. and Wingender, E. (2016) Multi-omics “upstream analysis” of regulatory genomic regions helps identifying targets against methotrexate resistance of colon cancer. EuPA Open Proteomics 13, 1-13. Link
  • Koschmann, J., Bhar, A., Stegmaier,P., Kel, A. E. and Wingender, E. (2015) “Upstream Analysis”: An integrated promoter-pathway analysis approach to causal interpretation of microarray data. Microarrays 4, 270-286. Link
  • Kel, A., Kolpakov, F., Poroikov, V., Selivanova, G. (2011) GeneXplain — Identification of Causal Biomarkers and Drug Targets in Personalized Cancer Pathways. J. Biomol. Tech. 22(Suppl), S16. Link

Get platform now

Make your registration and get your basic platform account for free now!


Register via this form to immediately get your free geneXplain platform account.

Select the “Registration for a free platform account” option at the top of the form to proceed.


Register your free account


Please note that the free account provides 15 MB disk space for performing the analysis. In case you will exceed this limit, an email will be sent to the address you have provided upon registration and your account will be transferred to a read/delete access mode within 3 days. Starting from that point, you will have 30 calendar days to either delete your data to meet the free account limit of 15 MB, or purchase disk space from us. In case no further action will be taken by you within this period, all your data will be permanently deleted, after what your account will be reactivated.

If you will have any questions towards the geneXplain platform disk space purchasing procedure, please contact us via this form or by email inquiries@genexplain.com.

News

Find history in our archive.
Upcoming events
May 14, 2024

ATAC-seq, CUT&RUN and Enhancers

The next Coffee break with TRANSFAC will be held on May 14th at 6 PM CEST. Leave your question for the upcoming event or receive event joining link to your email address. See you soon!

April 30, 2024

geneXplain platform API

The next Coffee break with TRANSFAC will be held on April 30th at 10 AM CEST. Leave your question for the upcoming event or receive event joining link to your email address. See you soon!

April 22, 2024

Promoter analysis of plants

The next Coffee break with TRANSFAC will be held on April 22nd at 10 AM CEST. Leave your question for the upcoming event or receive event joining link to your email address. See you soon!

April 16, 2024

Your first TRANSFAC analysis - Coffee break with TRANSFAC April 16th 6 PM CET

The next Coffee break with TRANSFAC will be held on April 16th at 6 PM CET. Leave your question for the upcoming event or receive event joining link to your email address. See you soon!

×