Tools
The PWMs in TRANSFAC are the basis for TFBS predictions with the included tools for analysis of DNA sequences of individual promoters, enhancers and other regulatory regions to the analysis of Omics data derived gene sets (DEGs).
Site Analysis introduction
What is Site Analysis?
Binding sites for proteins in the genome have a great regulatory impact on the gene activities in their neighborhood. Since these interactions are highly dynamic with regard to the cell’s status, we have experimental knowledge about the actual occupancy of these sites only for a very small percentage of them. Predictive tools are thus essential for deciphering the full regulatory potential of gene control regions like promoters, enhancers, etc.
Approaches to site analysis
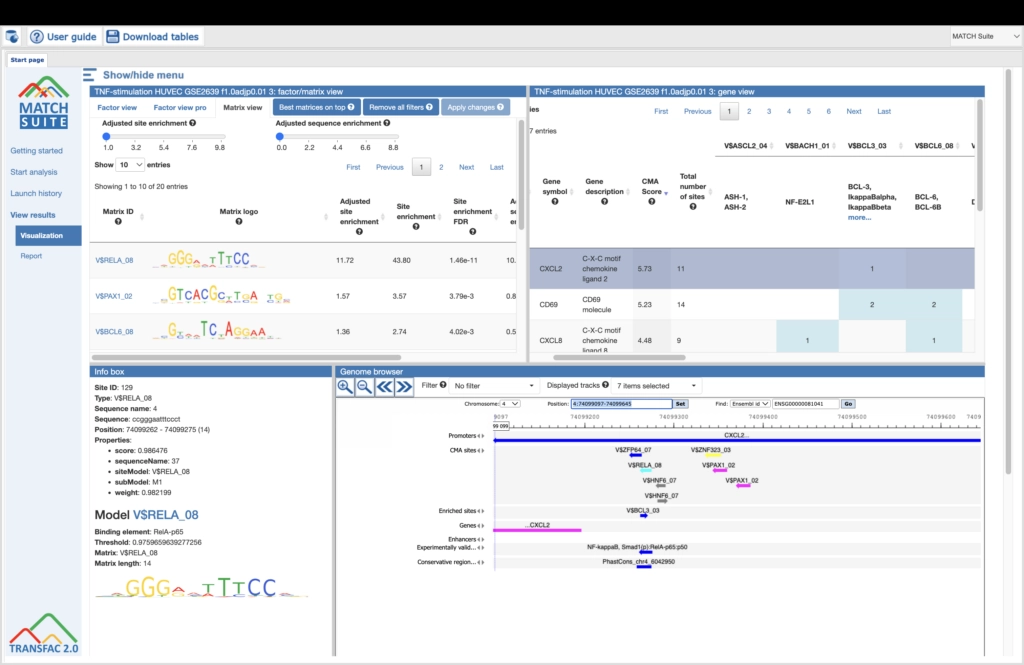
Among the most popular methods to identify potential transcription factor binding sites (TFBSs) is the use of position-specific scoring or positional weight matrices (PSSM or PWM). The TRANSFAC® database, the gold standard in the field, harbors the largest collection of PWMs. They are used to predict TFBSs either by MATCH Suite, which is part of the TRANSFAC®2.0 online resource, or by a number of programs that are included in the geneXplain platform.
Site analysis in the geneXplain platform
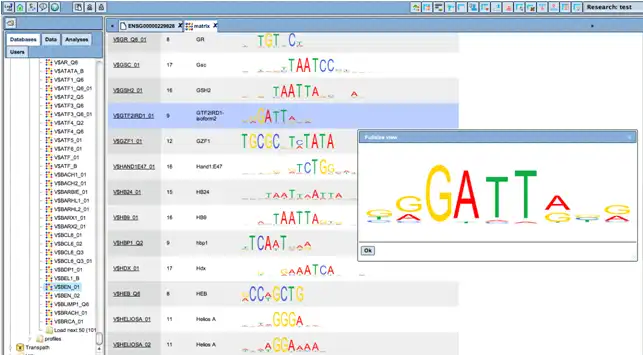
The sequence patterns individual TRANSFAC matrices represent and recognize are visualized as logo plots.
These matrices can be individually selected and combined to “profiles”; a number of pre-defined profiles are available for subsequent sequence analysis. Matrix matches are visualized along the gene sequences in a customizable manner.
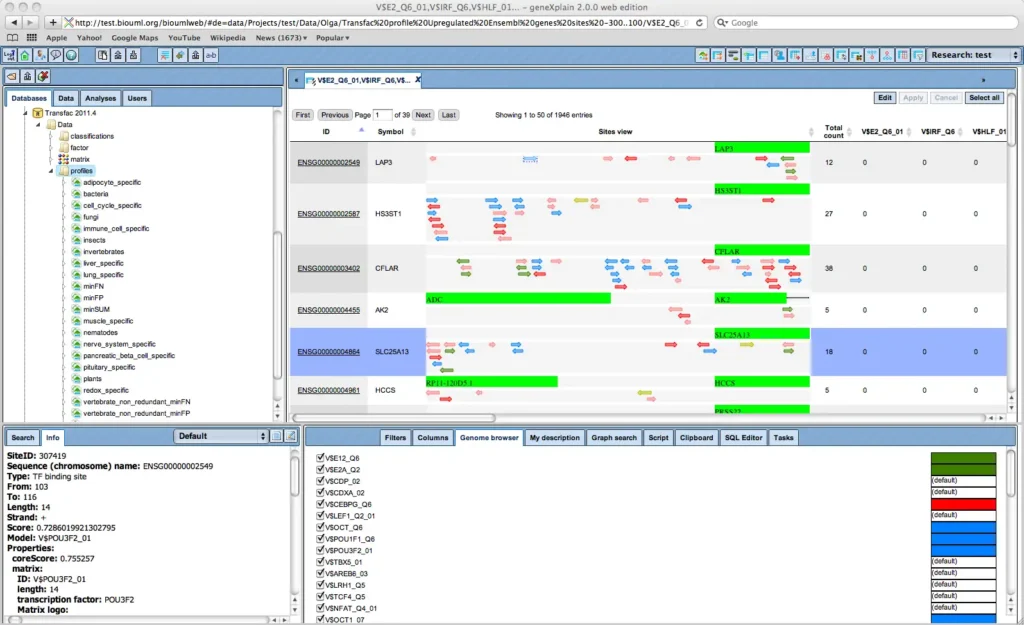
Visualization of transcription factor binding sites (TFBSs) with geneXplain platform’s genome browser.
The built-in genome browser enables to comfortably zoom-out to chromosomal level, or to zoom-in to the nucleotide level. Individual sites are clickable to invoke detailed information.

Advanced promoter analysis
State-of-the-art analysis of regulatory regions has to exceed recognition of single sites. Functional promoters, and presumably enhancers and other regulatory regions, are characterized by specific arrays of individual sites. As variable as their compositions may be, the syntax of sites in each regulatory region has to follow defined rules, which are largely unknown yet.
Therefore, the geneXplain platform provides an empirical way to identify the specific combination of sites that characterizes a given set of co-regulating promoters.
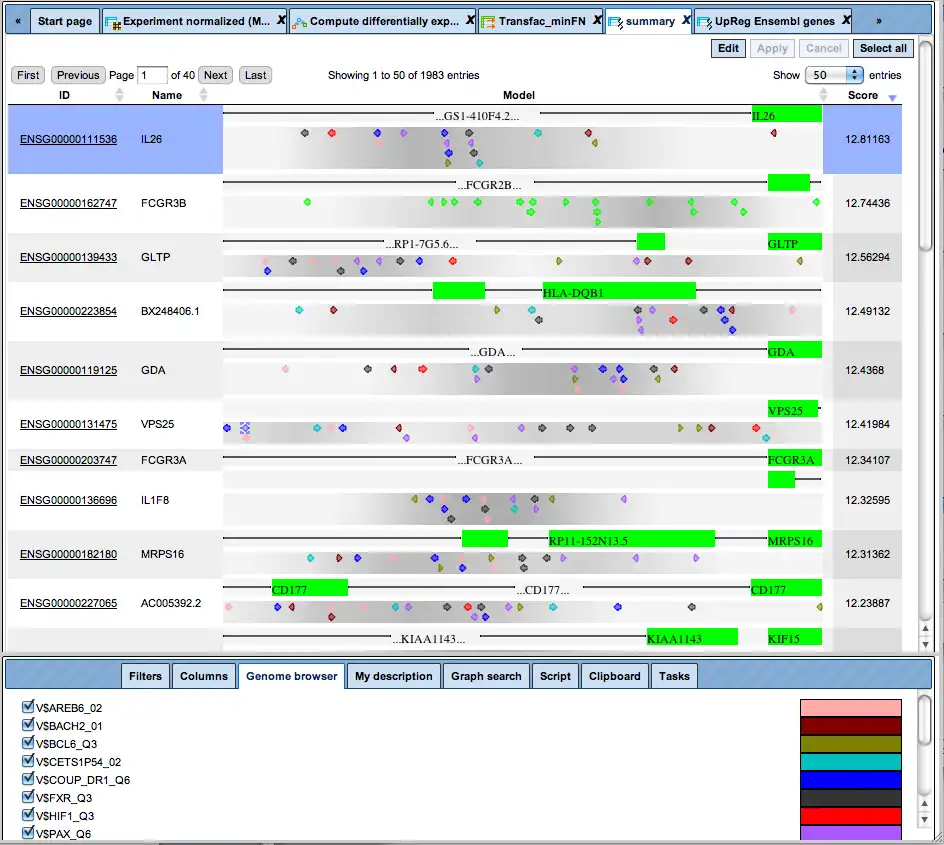
Complex promoter analysis, visualization of transcription factor binding sites (TFBSs) constituting a “promoter model”.
These specific combinations, also called “promoter models”, can be further used for screening genomic sequences or promoter databases. A comprehensive collection of mammalian promoters comes along with the TRANSFAC® database in its TRANSPRO section. The density of model matches is visualized by graded shading.
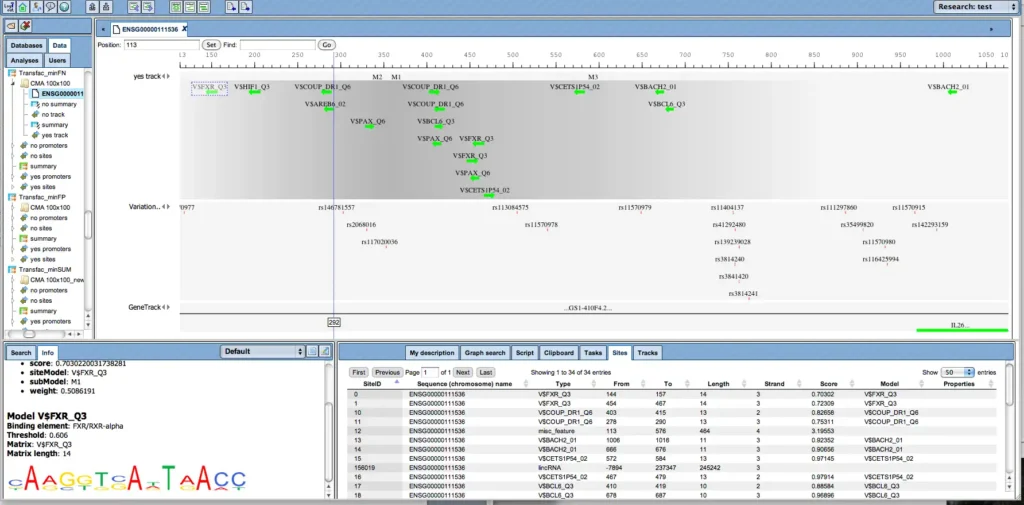
Promoter analysis for matches with a model comprising a set of transcription factor binding sites (TFBSs).

