Raw omics data processing
Raw omics data processing
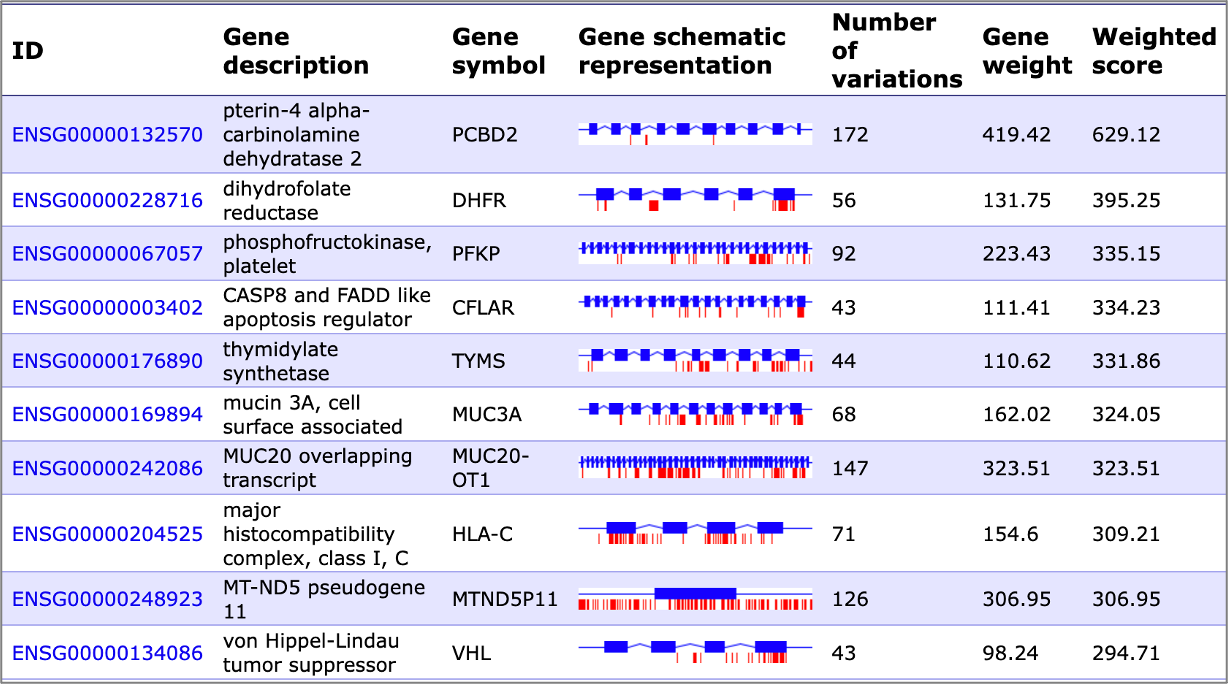
Identification of genes carrying sequence variations
We can identify mutated regions in your genomics data coming in a number of formats (*.vcf *.txt, *.csv, *.xls (table data with SNP identifiers, rs*), *.tsv *.fastq):

Weighting of mutations can be done in respect to a variety of parameters, as well as it can be calculated as their weighted sum:
– Location of mutation (e.g. exon area or promoter region, or other location)
– Gain or loss of transcription factor binding site as a result of mutation (mutation effect on the transcription factor binding affinity)
– Belonging of the gene with sequence variation to a certain category (e.g. disease relevance or role in signaling pathway)
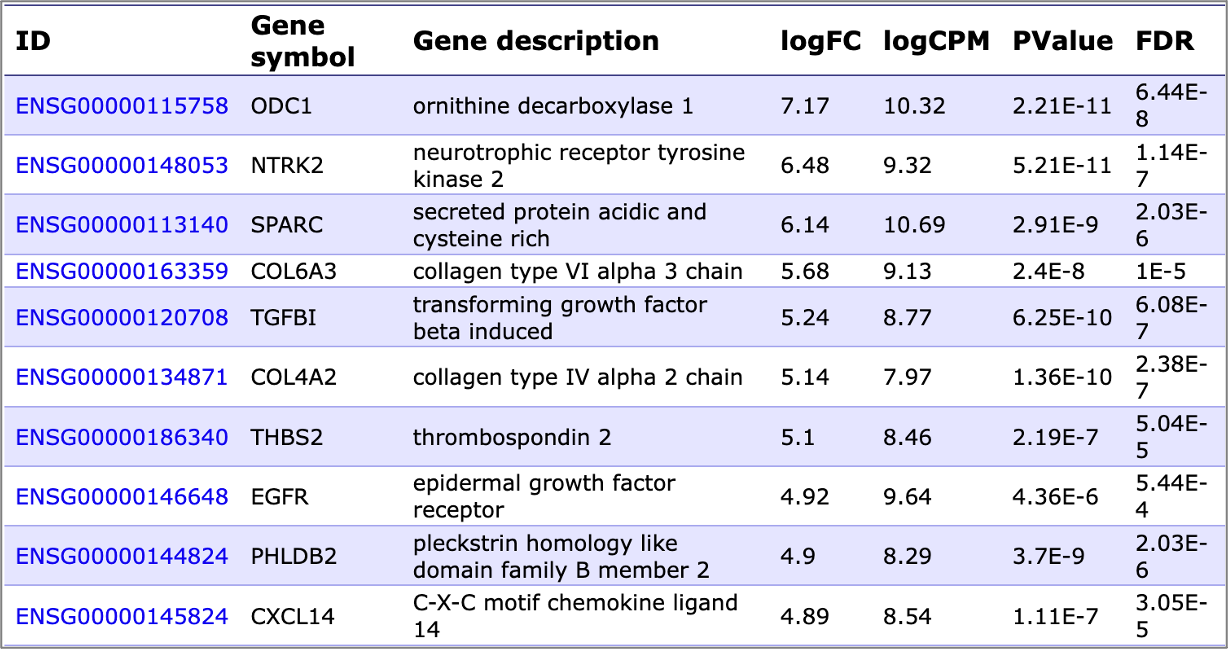
Identification of differentially expressed genes
We can identify upregulated and downregulated genes is your transcriptomics data coming in a number of formats (*.txt, *.csv, *.xls (table with gene identifiers) *.CEL (affymetrix) *.txt (special agilent format) *.txt (special illumina format) *.fastq):

In case of raw RNA-seq data analysis (*.fastq files) we will also perform the identification of sequence variations located in the performed reads
Data sheet preparation for Ingenuity Pathway Analysis (IPA) input
We can pre-process your raw transcriptomics data for IPA input: depending on your preference, we will provide you with ready tables containing the raw counts, TPM or RPKM values. Further info on possible integration of geneXplain tools and services with IPA can be found here.
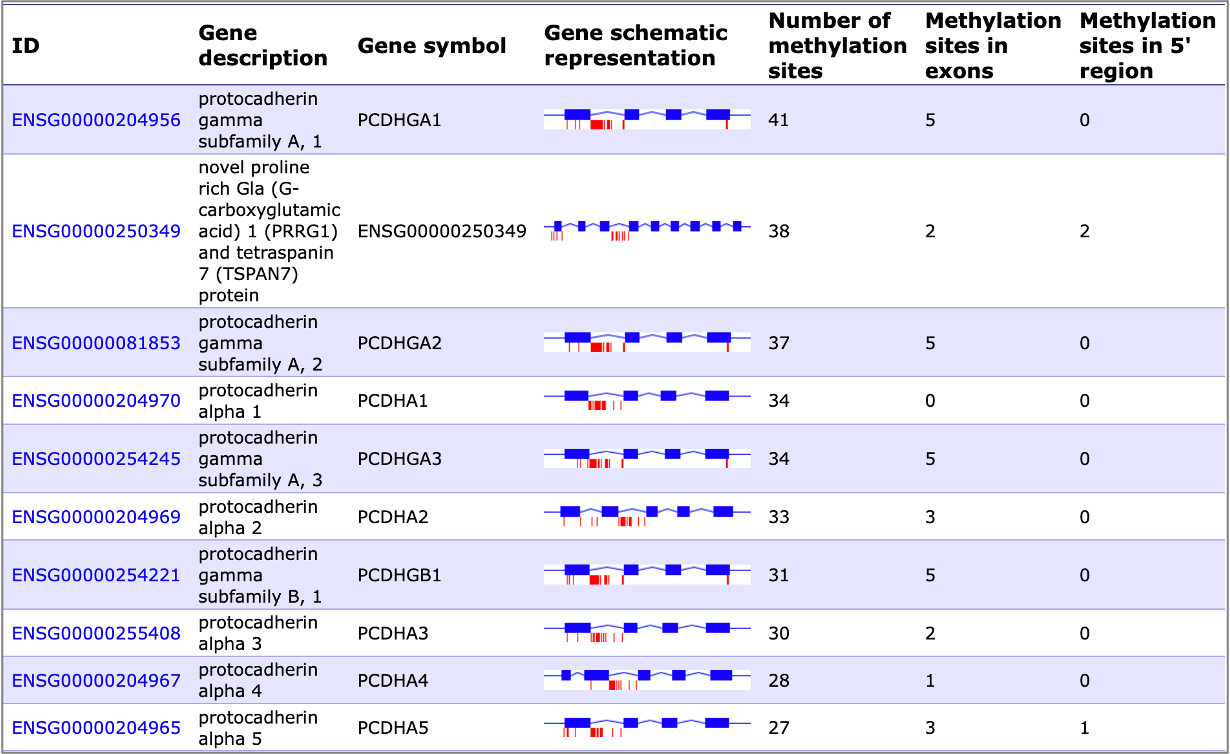
Identification of target genes from ChIP-seq data
We can identify target genes from your ChIP-seq data coming in a number of formats (*.fastq *.bam *.bed *.txt (table with illumina methylation probe ids, cg*)). As an example, here is how the list of highly methylated genes could look like in your analysis report:


