Genes categorization
Genes functional annotation
Identification of the enriched Gene Ontology (GO) categories, pathways, or diseases in your gene set
This service is available for the following categories:
Gene Ontology
- biological process
- cellular component
- molecular function
TRANSPATH® pathways
Reactome pathways
HumanCyc pathways
HumanPSD™ diseases
Example visualizations:
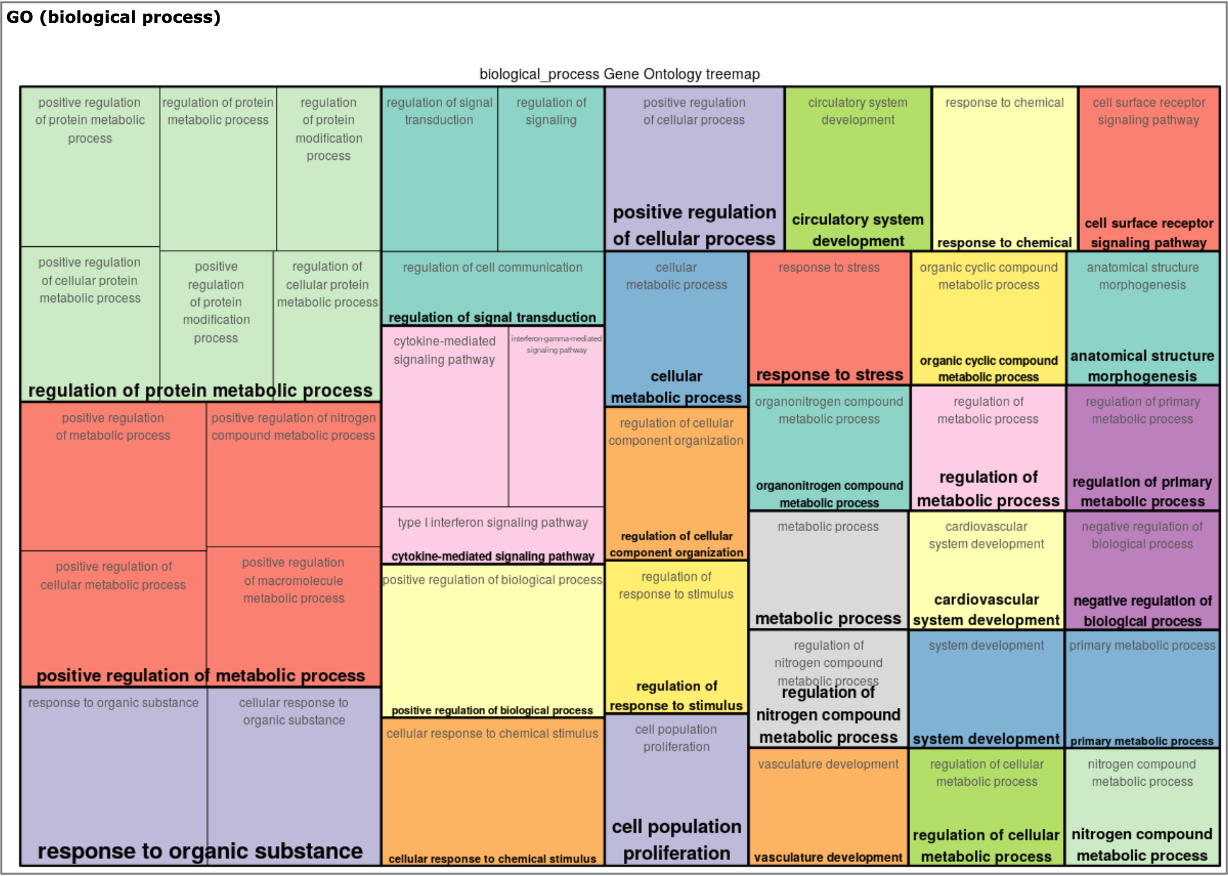
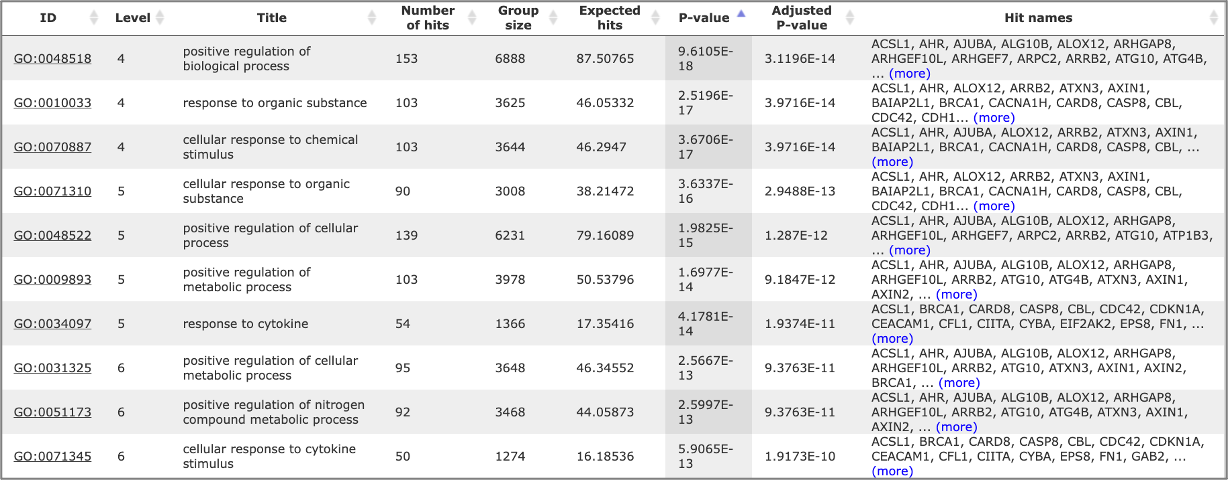
Biological processes to which genes from your input gene set belong to can be visualised by us in a tree map or table view:
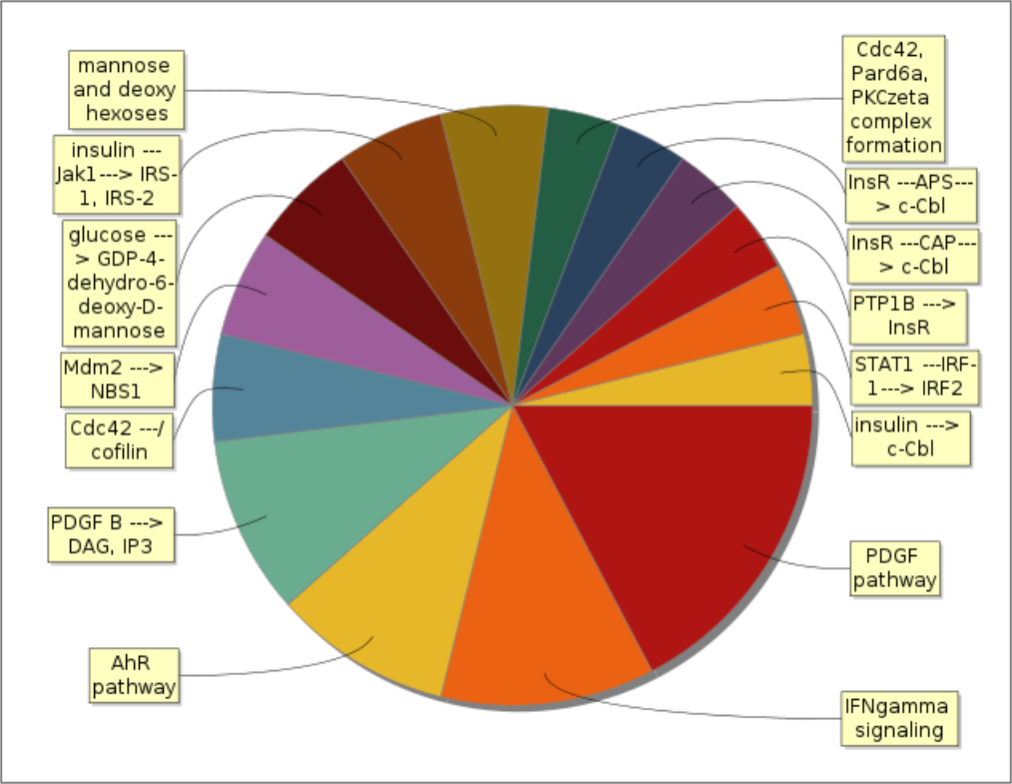
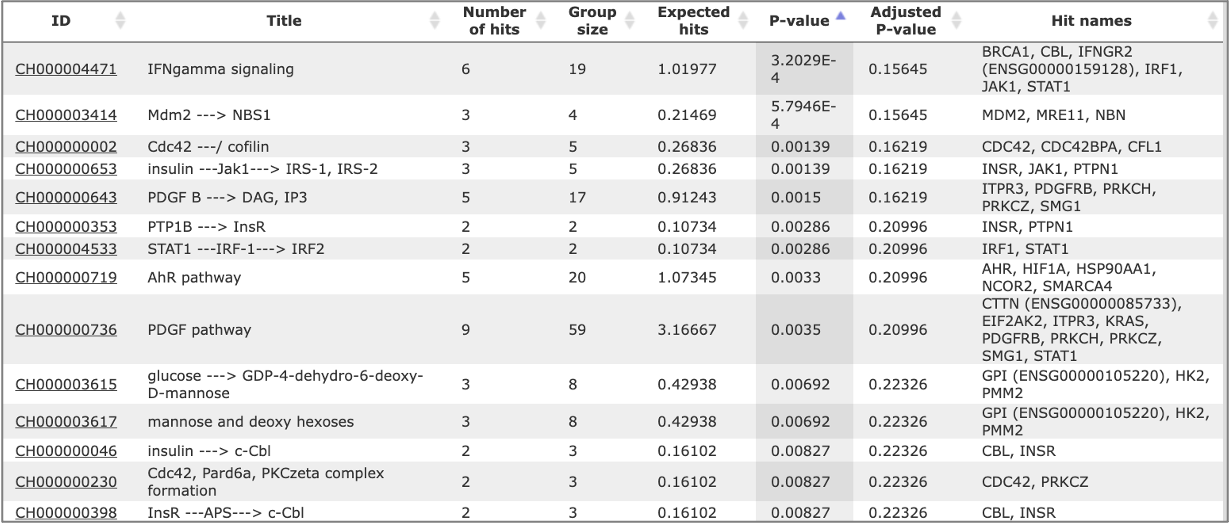
Signaling pathways in which genes from your gene set are involved can be visualised by us in a graphical or table view:
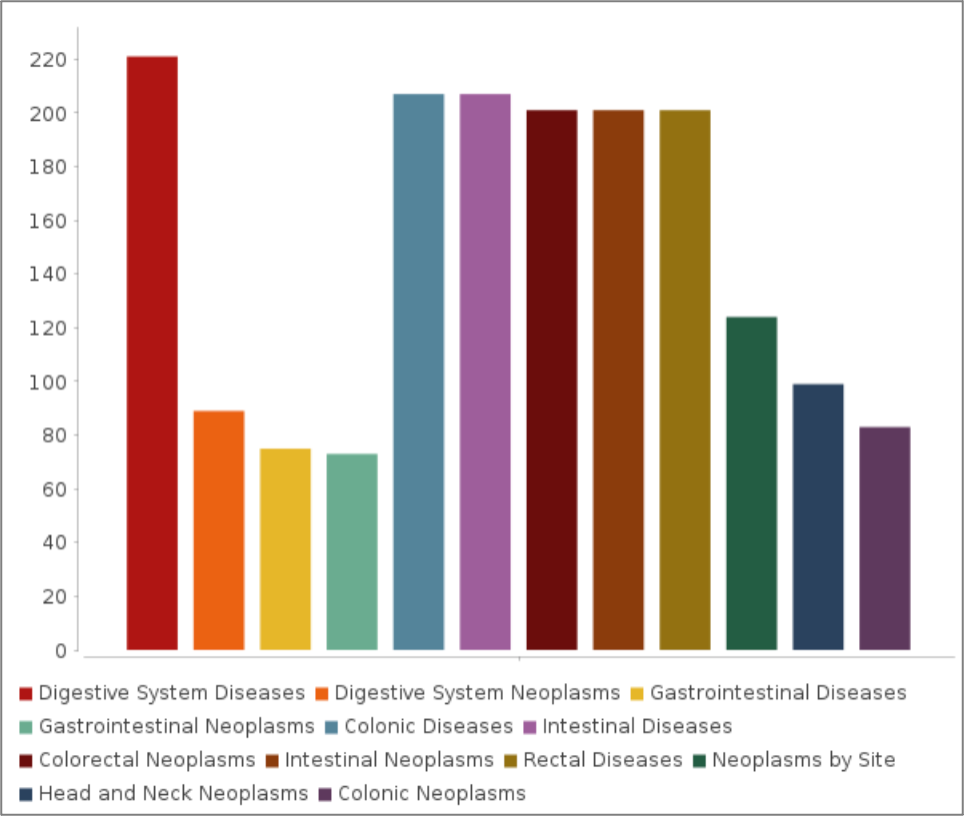
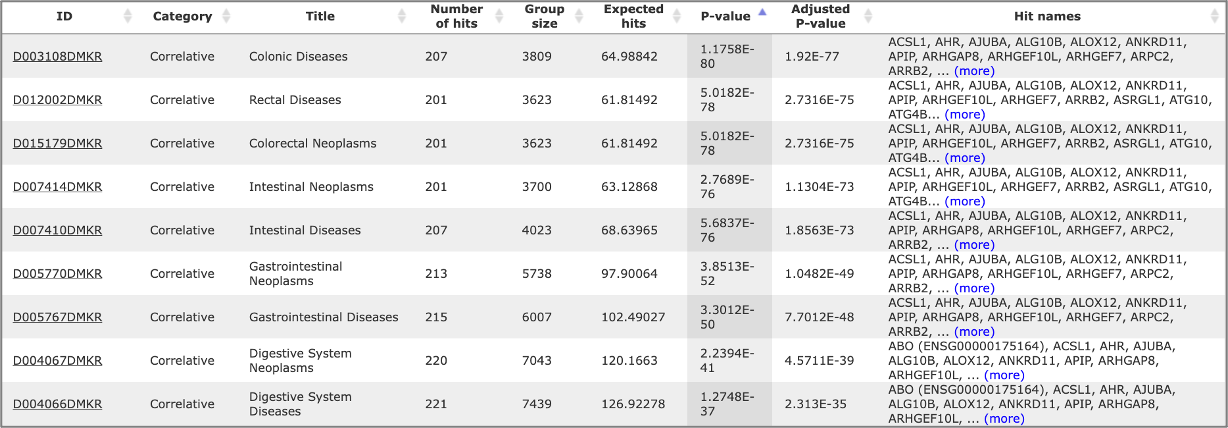
Human diseases biomarkers of which are enriched in your gene set can be visualised by us in a graphical or table view.
Want to see how all these visualizations can be integrated into one analysis pipeline starting from target genes identification out of raw omics data and ending with identified master regulators of the studied process? Check out this demo report constructed on the basis of RNA-seq data analysis (raw *.fast files) taken from GSE32424 dataset on Esophageal Squamous Cell Carcinoma:
Esophageal Squamous Cell Carcinoma (GSE32424) — Transcriptomics, FASTQ