Triple Negative Breast Cancer RNA-seq data analysis in geneXplain platform
Analysis of transcriptomics in triple-negative breast cancer cells.
Introduction.
Triple negative breast cancer is characterized by the absence of expression of the three genes that are used as biomarkers and drug targets in other types of breast cancer, the estrogen receptor (ER), progesterone receptor (PR) and human epidermal growth factor receptor 2 (HER2).
Aim of this analysis is to identify master regulatory molecules in triple negative breast cancer as well as the regulatory transcription factors that might serve as biomarkers and putative drug targets.
Dataset.
RNA-seq FASTQ files are taken from Gene Expression Omnibus, GSE188914. The reference to the original publicationis PMID 35014681. Here, we focus on comparison of gene expression in MDA 231, a triple negative breast cancer cell line, versus MCF-7, an estrogen receptor positive cell line. There are three replicates of each cell line.
Software and databases applied.
The analysis has been done applying the geneXplain platform equipped with the TRANSFAC® and HumanPSD™+TRANSPATH® databases.
Ensembl GRCh38, Entrez, Reactome, HumanCyc databases have been used as they are integrated in the geneXplain platform.
Ready-to-run workflows in the geneXplain platform applied in this study are the following.
· Full RNAseq analysis with subread, featureCounts and limma (single-end)
· Mapping to ontologies (HumanPSD(TM))
· Upstream analysis with feedback loop (TRANSFAC(R) and TRANSPATH(R))
From FASTQ files to DEGs.
Within the geneXplain platform there are ready-to-run workflows (pipelines) which take FASTQ files and output a list of differentially expressed genes (DEGs). The workflows differ by the integrated read alignment and counting methods and by the methods to calculate DEGs. Here, we have applied the workflow with subread_align method to map the RNA-seq reads on the reference genome, the featurecounts method to count the number of reads and the limma_voom method to calculate LogFoldChange and p-value of gene expression.
Three FASTQ files for MDA 231 cells and three FASTQ files for MCF-7 cells have been submitted to the mentioned workflow in the platform.
The workflow output contains a gene table with calculated Log Fold Changes and P-values.
Further, genes were filtered to identify up-regulated, down-regulated as well as non-changed genes.
The details on how the FASTQ files have been uploaded in the geneXplain platform, the workflow structure and run are shown in the video:
The results of the workflow are shown in the video:
Functional classification of the up-regulated genes.
The up-regulated genes have been mapped to the Gene Ontology terms, to diseases and to pathways. We aimed to select a functional group of genes for further Upstream Analysis.
For this, we applied the next ready-to-run workflow in the geneXplain platform. The HumanPSD and TRANSPATH databases are the integral part of this workflow. The workflow maps the input genes to HumanPSD™ GO categories, TRANSPATH® pathways, Reactome pathways and HumanCyc Pathways, TF classification (TFClass) and also to the HumanPSD™ disease terms.
Let’s consider the results of mapping to the HumanPSD™ disease categories.
Some of the input genes are known biomarkers for particular diseases, this information is manually curated in the HumanPSD™ database. In the column Category, the classification of biomarkers is shown: correlative, causal, and several types more.
For further analysis the 437 genes known to be causal biomarkers for breast neoplasms have been selected. Important to note is that all these genes are significantly up-regulated in triple negative breast cancer cells versus ER-positive breast cancer cells.
The workflow Functional classification and its results are shown in details in the video:
Upstream analysis.
The workflow Upstream analysis with feedback loops has been applied. The TRANSFAC® and TRANSPATH® databases are integral parts of this workflow. This workflow performs the upstream analysis in two steps. The 1st step is detecting enriched transcription factor binding sites (TFBSs) and the 2nd step identifies the master regulators in the networks upstream of the identified transcription factors. Some master regulators are encoded by the upregulated genes, and they are part of the input set. As these upregulated molecules regulate the network of up-regulated genes, this creates a positive feedback loop.
In the first part of this workflow the input gene set is subjected to the method Site search on gene set which predicts TFBSs in the promoters applying TRANSFAC® matrices. In the second part of the workflow the method Regulator search is performed on the identified transcription factors using the TRANSPATH® network.
As the input for this workflow, we have taken the 437 genes upregulated in triple negative breast cancer cells and known as causal biomarkers of breast neoplasms. The 546 genes unchanged in the same experiment have been taken as the background set for comparison. The profile with TRANSFAC® matrices and the gene promoter sequences, -1000 to +100 relative to TSS, were taken as per the workflow default.
Promoter analysis and identification of the regulatory transcription factors.
The first part of the workflow has identified transcription factors that might be responsible for regulation of gene expression in breast cancer triple negative cells.
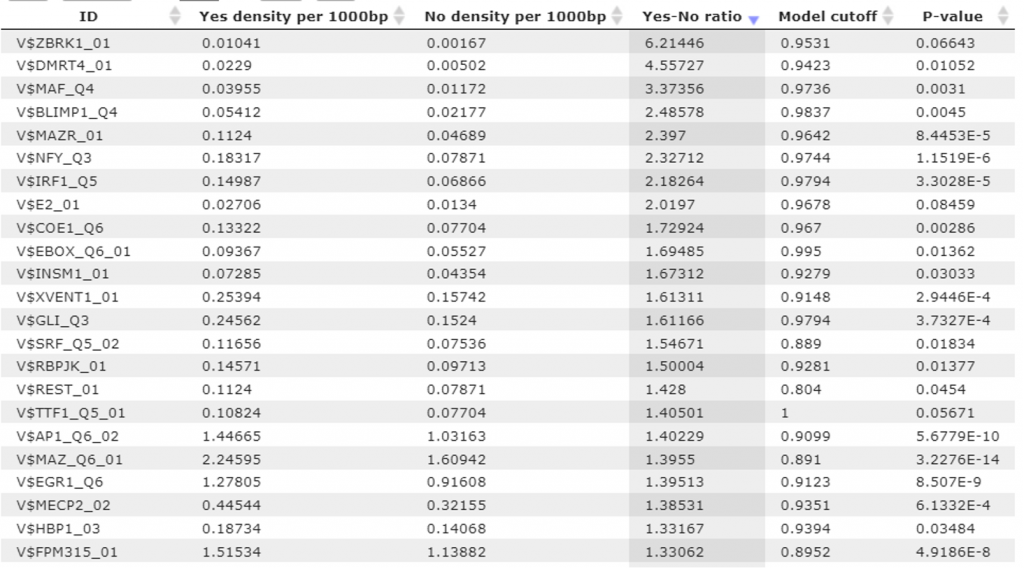
The summary table in the workflow output presents the site models (TRANSFAC matrices) with statistically significant over-represented matches in the promoters of genes up-regulated in triple negative breast cancer cells as compared with ER-positive breast cancer cells. 68 TRANSFAC® matrices with over-represented matches have been identified (Table 1).
Table 1. TRANSFAC® matrices with enriched matches in the promoters of triple negative breast cancer cells versus ER-positive breast cancer cells. The enrichment fold of the matches for each matrix (column Yes-No ratio), cutoff value corresponding to the enrichment fold (column Model cutoff) and P-value are shown.
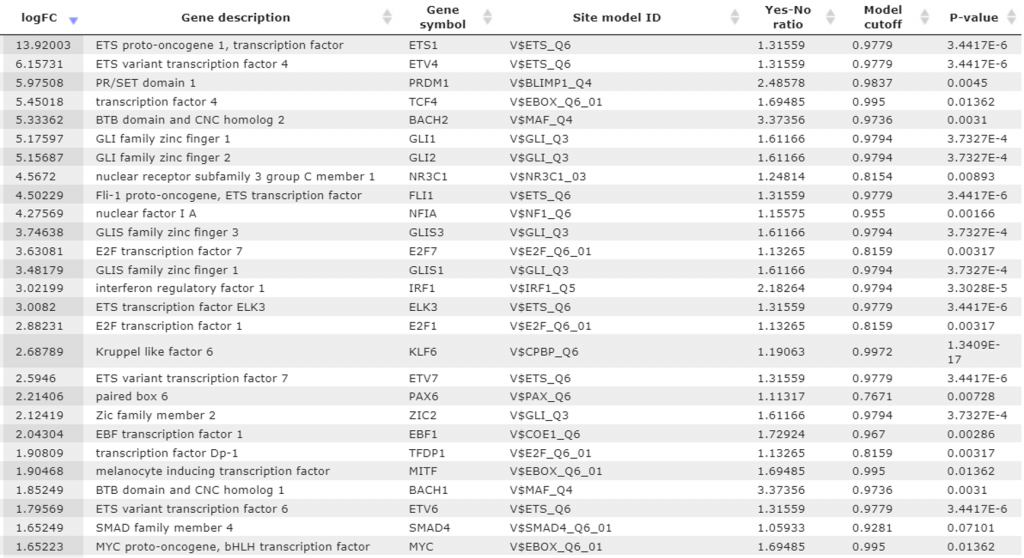
These 68 site models have been automatically converted into a list of transcription factors. The conversion resulted in 132 factors. Further, we have checked expression values for these TFs and and found that 46 of these factors are encoded by the upregulated genes (Table 2).
It is interesting to note that these 46 TFs are upregulated in triple negative breast cancer cells versus ER-positive breast cancer cells, and matches for the corresponding matrices are significantly over-represented in the promoters of upregulated genes.
For example, IRF-1 is upregulated with LogFC equal to 3,0, and the matches of the IRF matrix are over-represented 2,2-fold.
The analysis done suggests that these TFs are responsible for gene regulation in breast cancer triple negative cells. The 132 TFs with the over-represented matches were used as the input for the next step of the workflow, the master regulator search.
Structure of each promoter with the mapped TFBSs can be viewed in details both schematically and on the inbuilt genome browser.
The details of the promoter analysis and visualization of the results are shown in the video
Table 2. Transcription factors resulting from the 1st step of the Upstream Analysis. Each line presents one particular TF. For each TF, gene symbol and gene description are shown ordered by the expression value as LogFoldChange in triple negative breast cancer cells versus ER-positive breast cancer cells (column logFC). Additionally, for each TF there is TRANSFAC® matrix (the column Site model ID), enrichment fold of the matches for this matrix (column Yes-No ratio), cutoff value corresponding to the enrichment fold (column Model cutoff) and P-value.
Identification of the master regulators in networks.
The master regulator search with feedback loops has been performed upstream of the input TFs, which resulted in 12 master molecules (Table 3).
Table 3. The resulting list with 12 master regulatory molecules sorted by the LogFC column. Each master regulatory molecule is characterized by a Score, Z-score, FDR, and Ranks Sum. Also, the expression values of the genes encoding master regulators are shown (column logFC). The column “Hit names” shows TFs that can be reached from the corresponding master molecule.
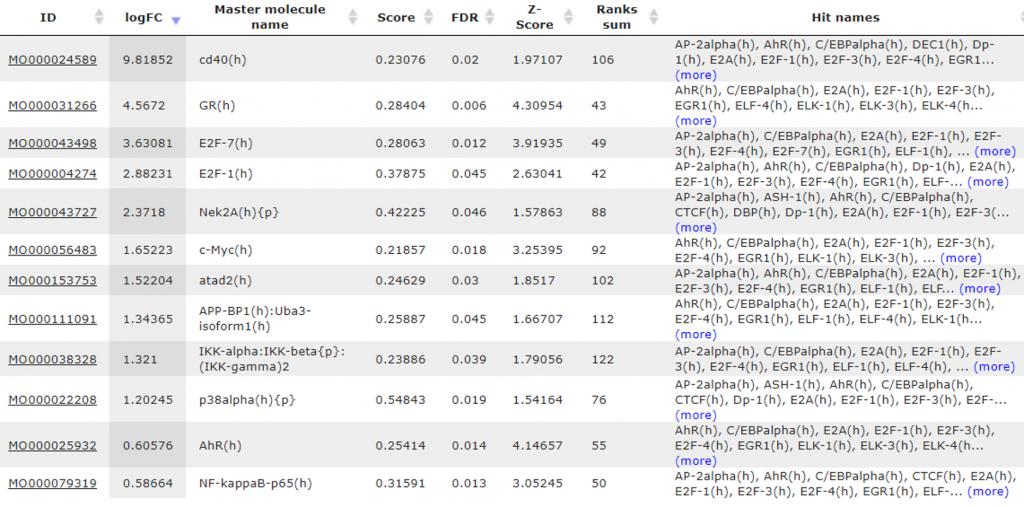
These master regulatory molecules are upregulated in triple negative breast cancer cells versus ER-positive breast cancer cells. The top up-regulated molecules are the following: cd40 with LogFC almost 10-fold; GR is upregulated 4,5 times; E2F7 and E2F1 are both upregulated with LogFC 3,6- and 2,9-fold correspondingly; Nek2A with LogFC 2,4-fold; c-Myc with LogFC 1,7-fold. The identified master regulatory molecules are responsible for the coordinated regulation of the networks below, and these networks can explain the differential gene expression in the comparison done. As genes encoding the master molecules are up-regulated by transcription factors in networks downstream of the master molecules, they constitute positive regulatory feedback loops.
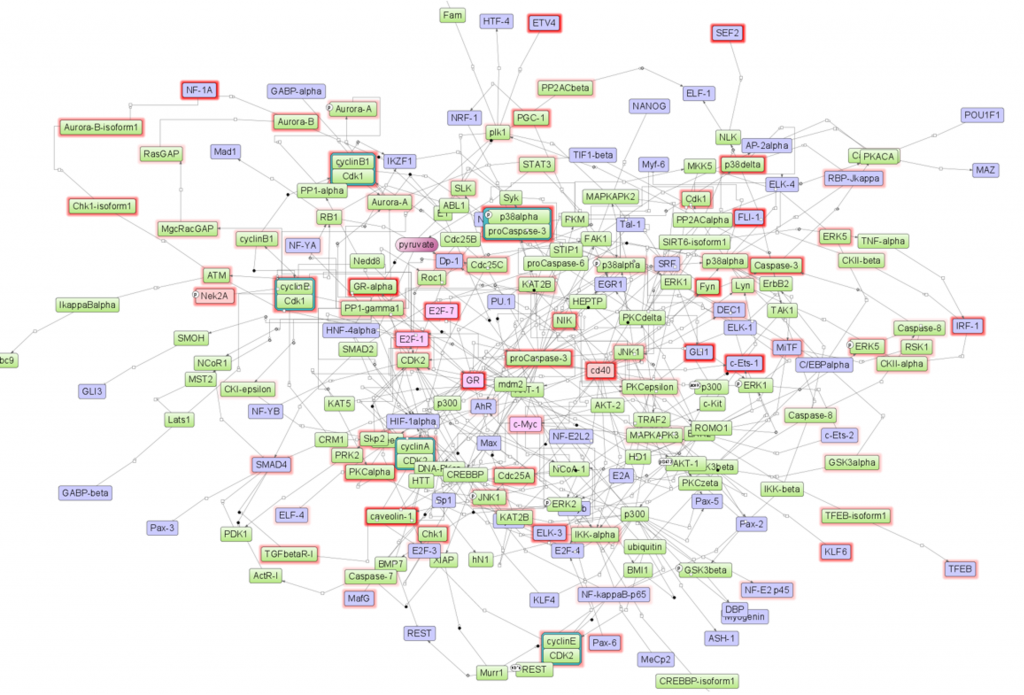
For each individual master regulator or for several master regulators together the identified network can be visualized. As an example, the network of top 6 master molecules is shown (Fig. 1)
Our analysis suggests that these molecules play a significant role in regulating pathways in triple negative breast cancer.
The details of the master regulator search and network visualization are shown in the video
Fig 1. The network of top 6 identified master regulators, all of them are encoded by the upregulated genes. The master molecules are shown by the pink color inside their shapes (CD40, GR, E2F1, E2F7, Nek1A and c-Myc). Blue color shows TFs that were used as input into the master regulator search, and green color shows intermediate molecules. All the reactions between molecules are integrated from the TRANSPATH® database. The red frames highlight upregulated molecules, and the intensity of the frame color reflects the fold of upregulation.
Discussion.
The analysis presented has identified promising master regulators in the signaling networks in triple negative breast cancer cells.
CD40 (in our diagram: cd-40) is a member of the TNF receptor family, and its association with triple-negative tumor has been published (PMID: 32256143). According to the expression data analyzed here, the gene encoding CD40 is highly over-expressed in MDA 231, a triple negative breast cancer cell line, versus MCF-7, an estrogen receptor positive cell line. The LogFoldChange for CD40 gene is 9.8 and it is the top up-regulated master regulatory molecule (Table 3).
As we know from the HumanPSDTM database, CD40 is associated with 70 diseases as a biomarker, among them a number of different tumors (Locus Report for CD40, https://portal.genexplain.com/cgi-bin/build_hpt/idb/1.0/pageview.cgi?view=LocusReport&gene_acc=GN000003091). Association of CD40 with breast neoplasms in general is well documented.
Here we show that very high expression levels of CD40 might be a specific marker of triple negative breast cancer cells even as compared to ER-positive breast cancer cells. Our study suggests a master regulatory role of CD40 specifically in triple negative breast cancer cells.