Prediction of human TFBS
Analysis of human genes for tissue- and GO-specific transcription factors (MATCH Suite)
In addition to the powerful classic geneXplain portal Match approach towards TFBS prediction, which is widely described on this page, the TRANSFAC 2.0 provides its users with the MATCH Suite tool for human genes analysis, which comprehensively addresses the syntax and semantics of gene regulation and allows you to identify the transcription factors regulating the gene(s) of your interest.
MATCH Suite can be launched immediately from the search results in the geneXplain portal interface:
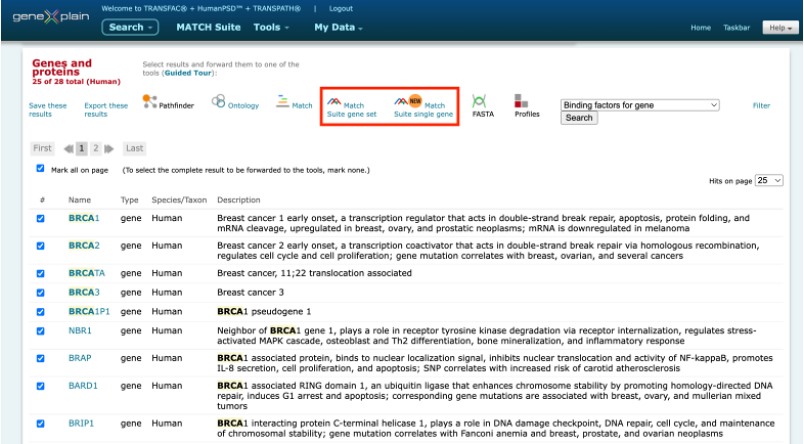
It can be also launched from a user-specified gene or gene set (from 20 to 2000 genes) in the gene symbol, Ensembl ID, or Entrez ID formats.
The tool also provides an option to construct a tissue-specific gene list from scratch:
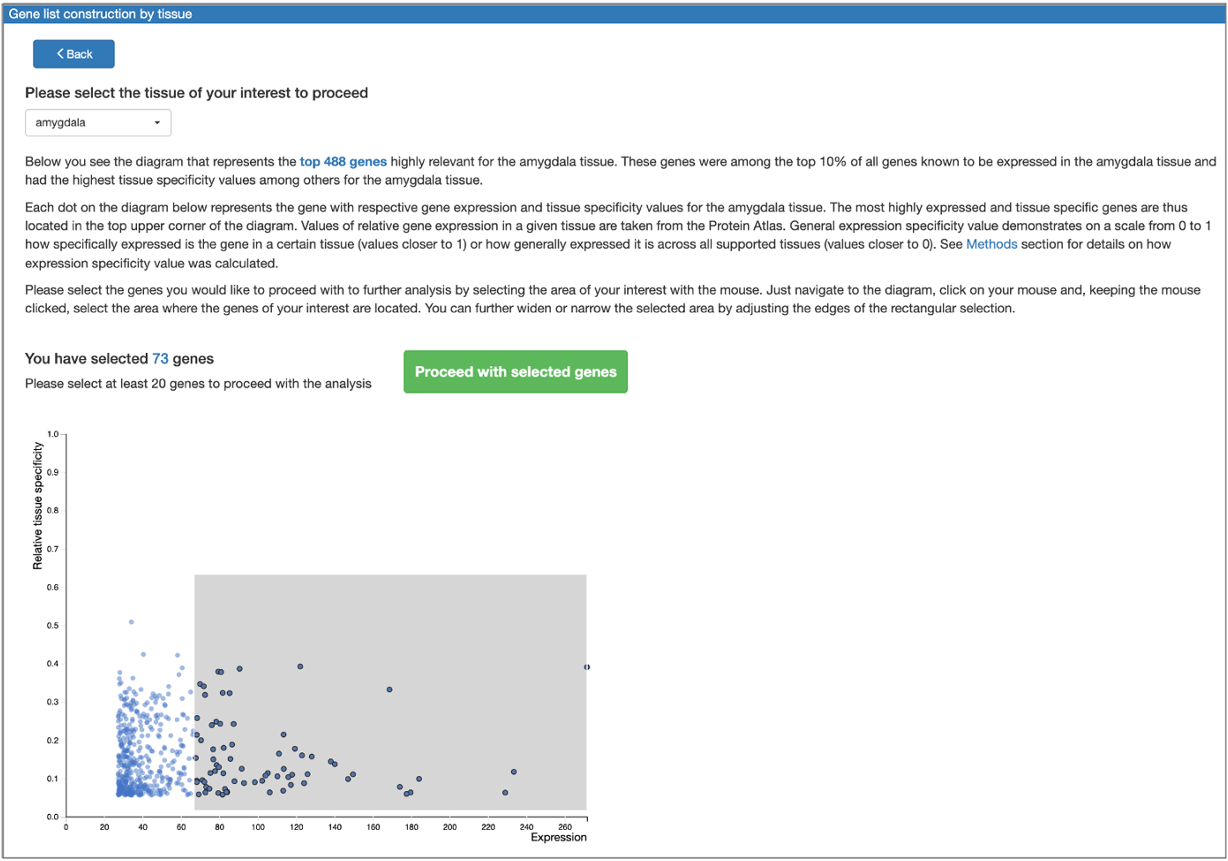
Gene(s) selected for analysis can be then submitted to the search for transcription factors responsible for their regulation. The resulting transcription factors can be pre-filtered to those representing the genes belonging to certain GO categories, or to those expressed in a given tissue. Gene list optimization in terms of selected GO categories belonging and expression in a given tissue can also be performed.
As the result of analysis, MATCH Suite provides a downloadable report and interactive results visualization interface with a variety of on-the-fly filters that can be applied to the received results. You can view the demo report of MATCH Suite single gene analysis or the demo report of the MATCH Suite gene set analysis for further details. Examples of main results visualizations are provided below.
Gene set analysis
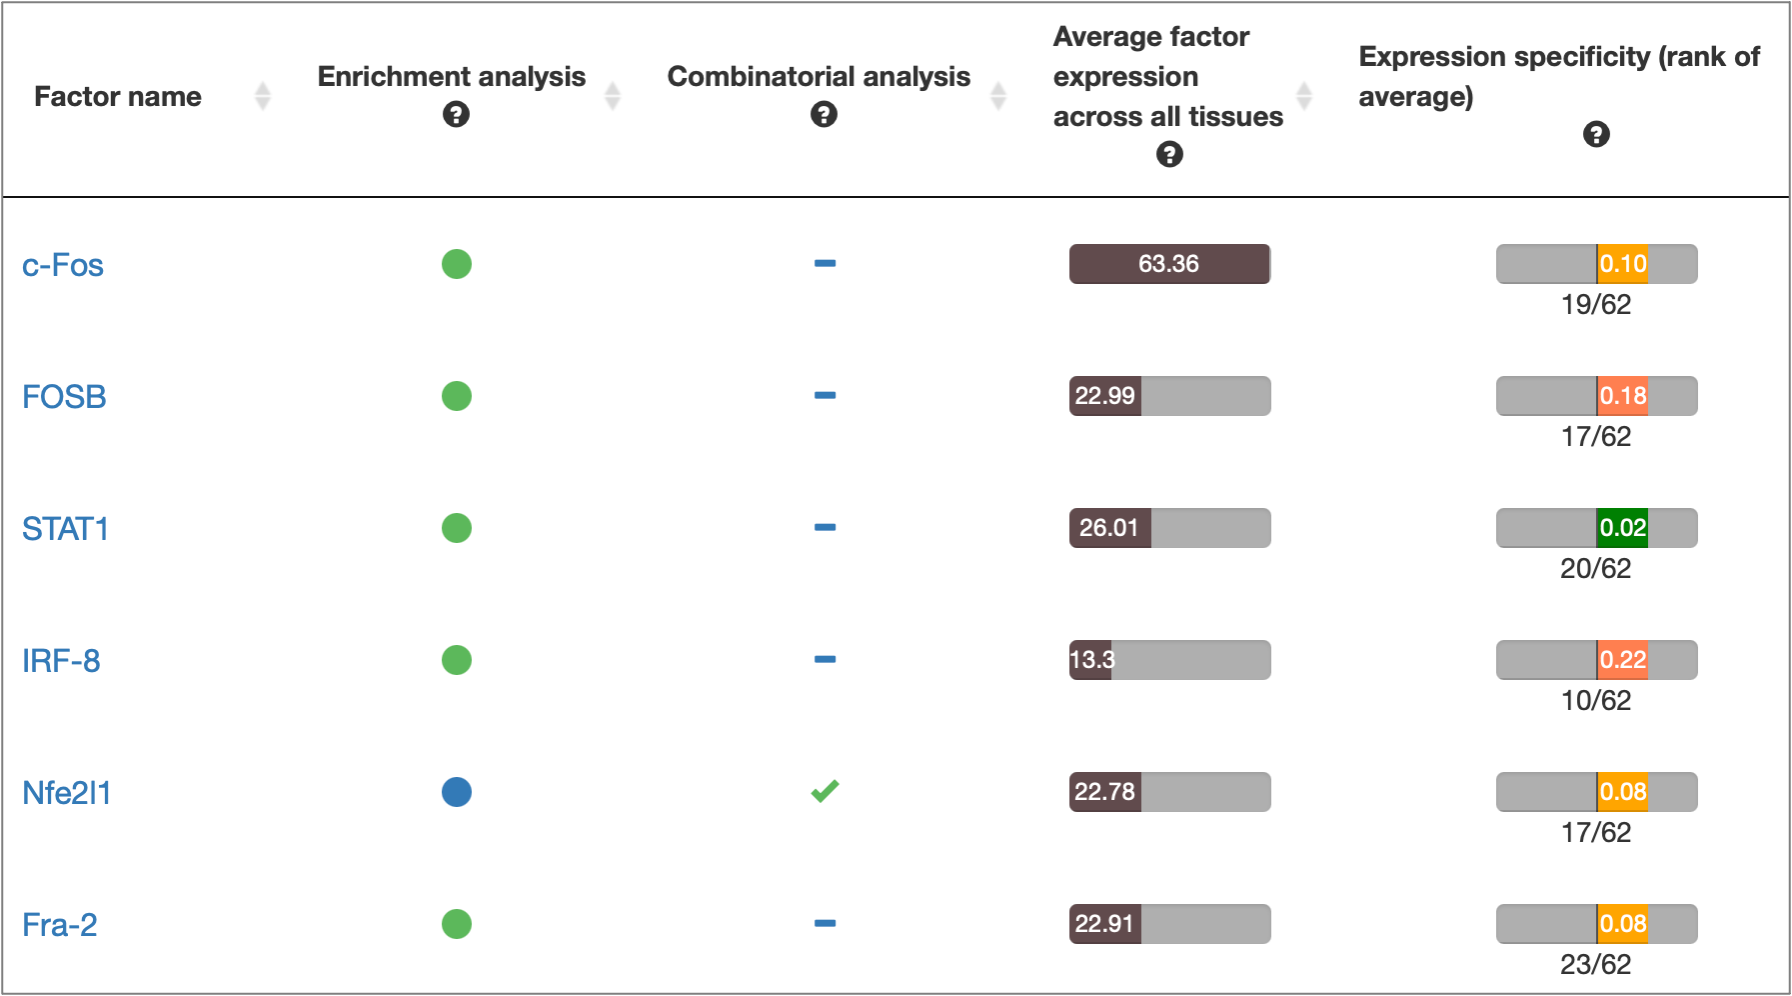
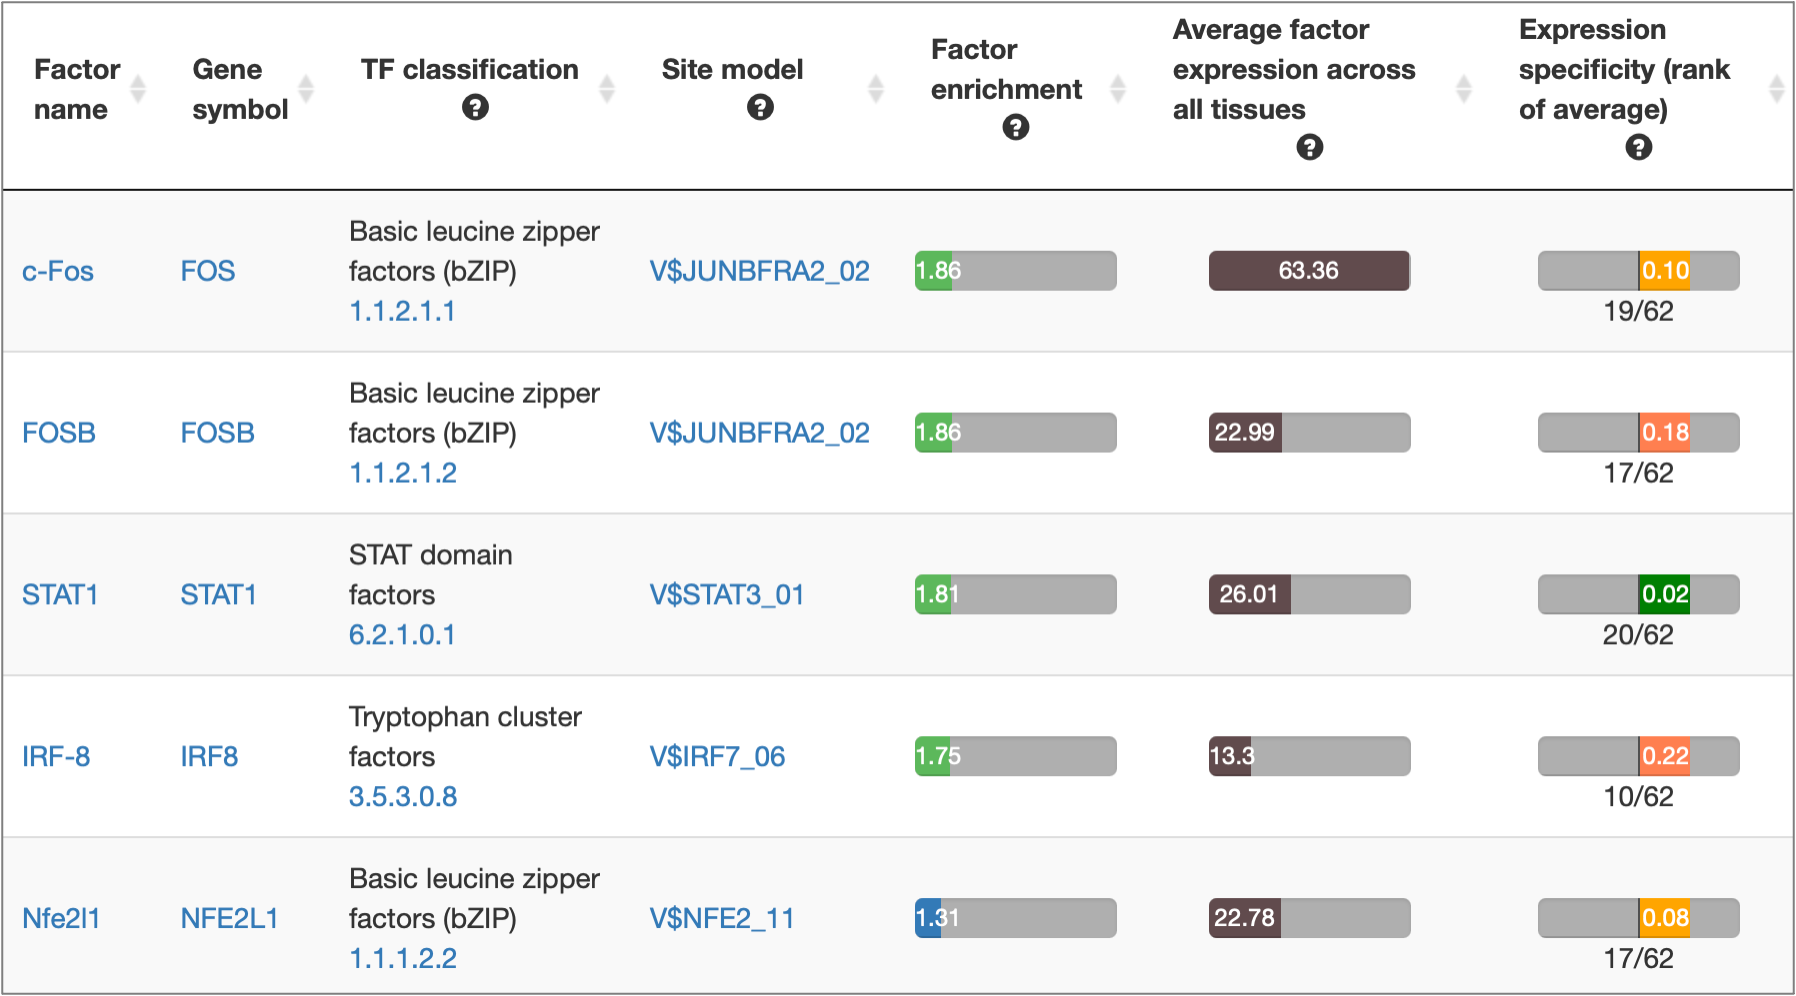
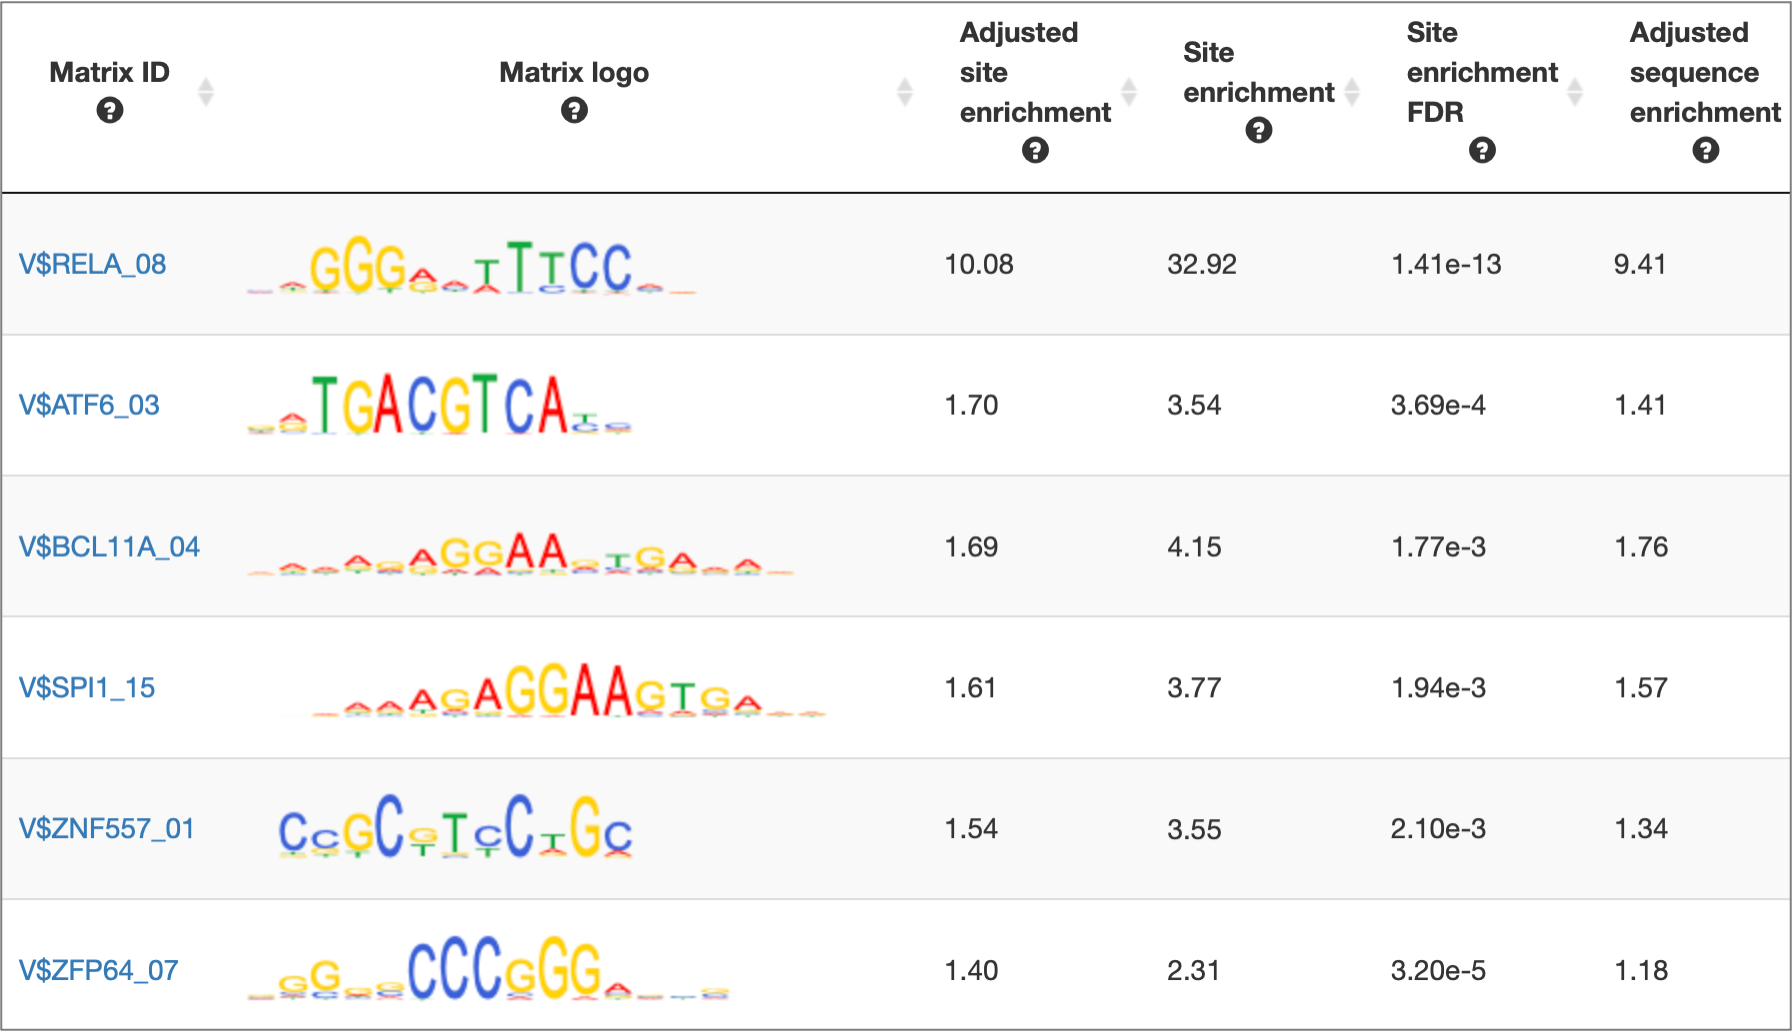
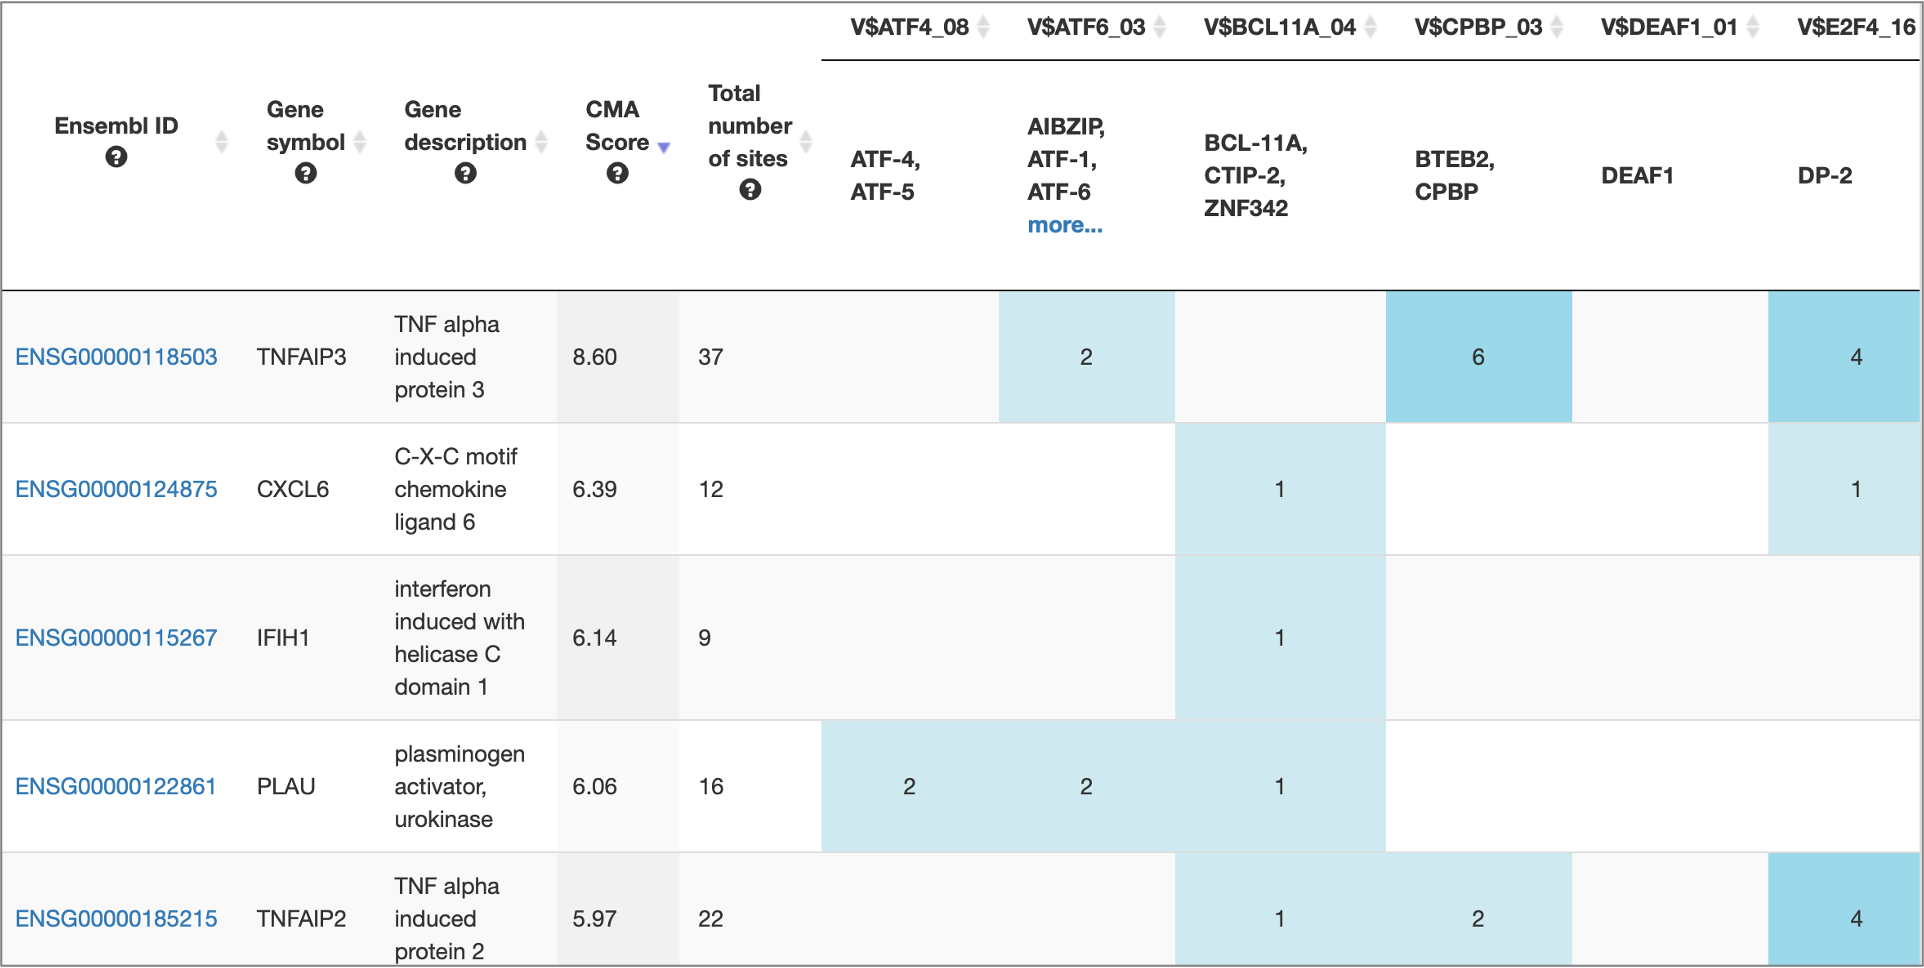
The interactive results visualisation section of the MATCH Suite provides you with dynamically filterable tables of the eventually identified TFs and respective matrices (binding models). The genes from the input set are compiled to a dynamically updating table, which demonstrates the regulation of these genes by respective TFs and binding motifs. Interactive genome browser visualisation of the identified sites in the promoters of your input genes is providing intuitive overview of the obtained results and various customisable filters applied.
MATCH Suite gene set analysis result: Factor Overview table example:
MATCH Suite gene set analysis result: Factor Pro table example:
MATCH Suite gene set analysis result: Matrix table example:
MATCH Suite gene set analysis result: Genes table example:
MATCH Suite gene set analysis result: Genome browser visualisation example:

Single gene analysis
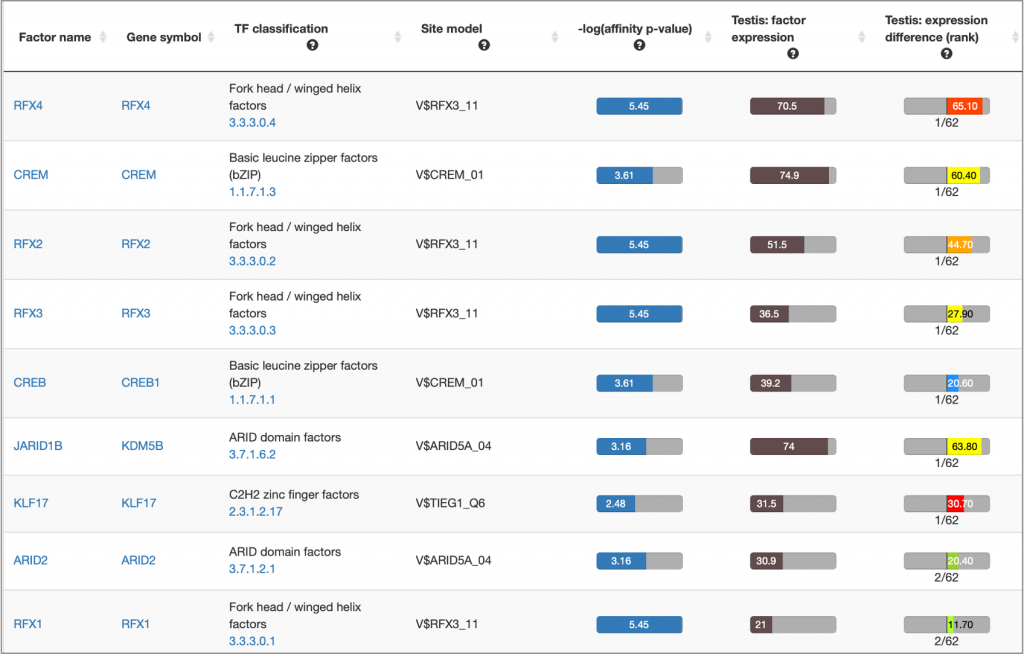
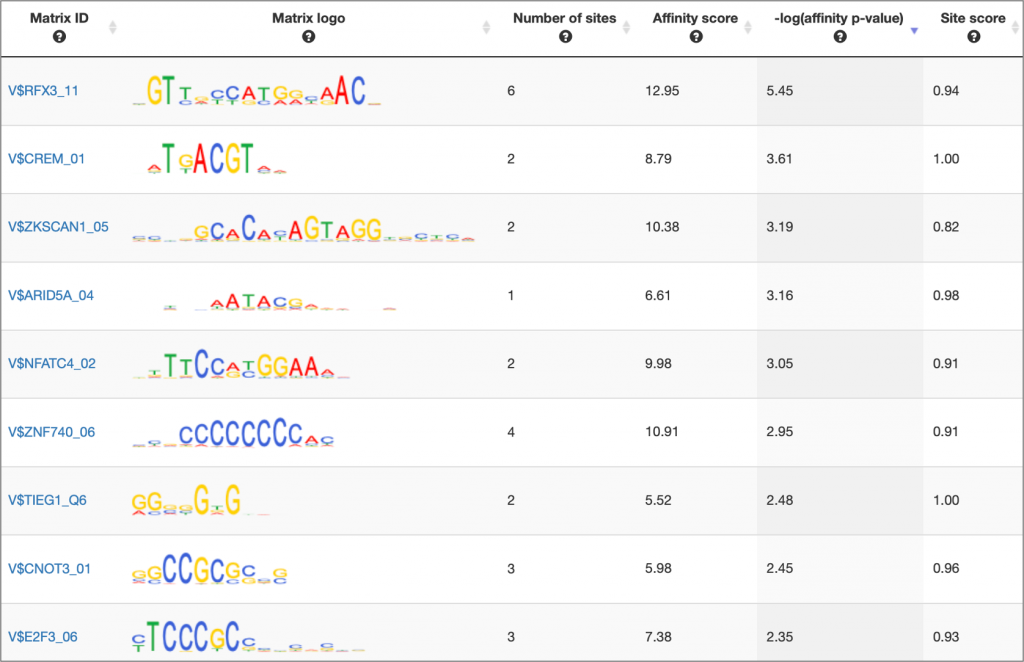
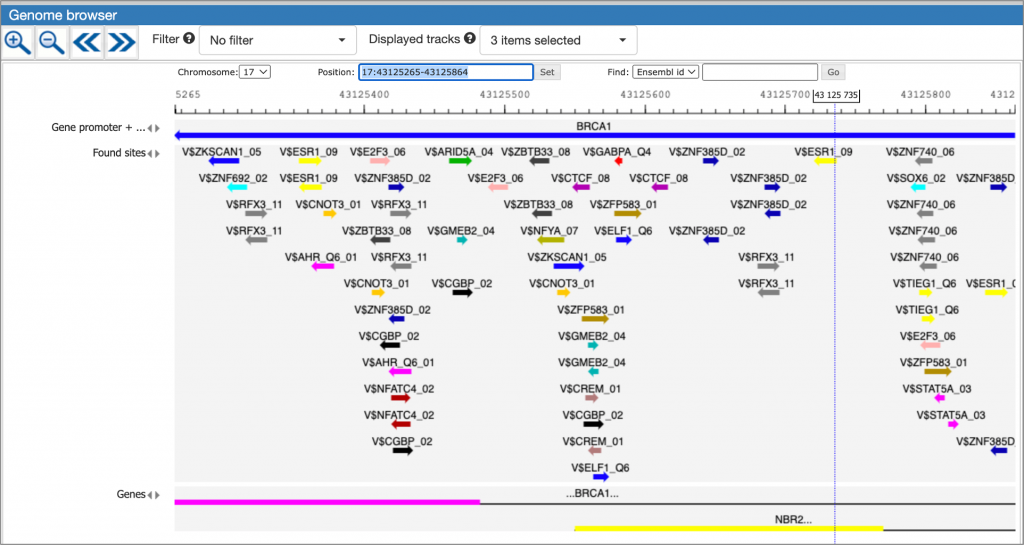
The interactive results visualisation section of the MATCH Suite provides you with dynamically filterable tables of the eventually identified TFs and respective matrices (binding models). The regulatory regions of the input gene (promoters and enhancers/silencers) are compiled to a dynamically updating table, which demonstrates the regulation of these regions by respective TFs and binding motifs. Interactive genome browser visualisation of the identified sites in the regulatory regions of your input gene is providing intuitive overview of the obtained results and various customisable filters applied.
MATCH Suite single gene analysis result: Factor table example:
MATCH Suite single gene analysis result: Matrix table example:
MATCH Suite single gene analysis result: Regulatory regions table example:

MATCH Suite single gene analysis result: Genome browser visualisation example:
A much more detailed description of MATCH Suite interface, as well as results interpretation guidance, can be found in the MATCH Suite user guide.
The full description of algorithms applied behind the MATCH Suite analysis can be found in the Methods single gene analysis and in the Methods gene set analysis documents.
