Site analysis in the geneXplain platform
The sequence patterns individual TRANSFAC matrices represent and recognize are visualized as logo plots.
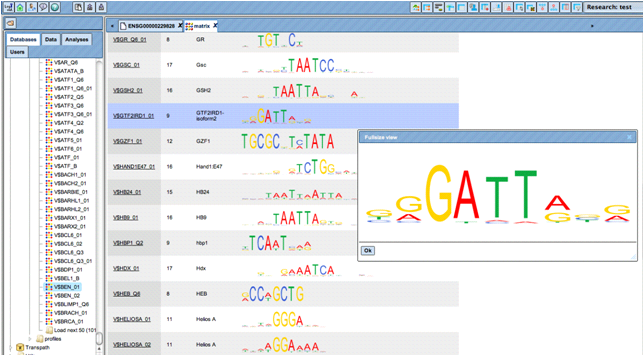
these matrices can be individually selected and combined to “profiles”; a number of pre-defined profiles are available for subsequent sequence analysis. Matrix matches are visualized along the gene sequences in a customizable manner.
![]()
Visualization of transcription factor binding sites (TFBSs) with geneXplain platform’s genome browser. Click image for an enlarged view.
The built-in genome browser enables to comfortably zoom-out to chromosomal level, or to zoom-in to the nucleotide level. Individual sites are clickable to invoke detailed information.
