Full feature list of platform 5.0
New RNA-seq features:
Rsubread – a Bioconductor software package that provides high-performance alignment and read counting functions for RNA-seq reads (NAR February 2019). Rsubread integrates read mapping and quantification in a single package.
Subread is a general-purpose read aligner which can align both genomic DNA-seq and RNA-seq reads, based on its unique seed-and-vote design, by which a large number of 16mer subreads from each read are mapped to the reference genome. The subread function accepts raw reads in the form of Fastq, SAM or BAM files and output read alignments in either SAM or BAM format. The output contains the total number of reads, the number of uniquely mapped reads, the number of multi-mapping reads and other mapping statistics. The align function is exceptionally flexible. It performs local read alignment and reports the largest mappable region for each read.
The align function automatically detects insertions and deletions (indels). First step of indels identification is mapping 16mer subreads from each read to the genome and determination of the major mapping location of the read. The second step undertakes a detailed local re-alignment of each read with the aid of collected indels. The align function also writes VCF files containing detected indels.
The align function can align read pairs arbitrarily far apart if the alignment is sufficiently good and no more canonical alignment is available. A weighting strategy is used to give preference to alignments within the expected fragment length bounds. Gene fusions are now supported by allowing different subreads from the same read to map to different chromosomes.
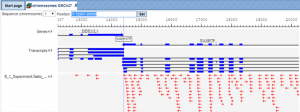
Figure 1 shows an example alignment output of the Subread-align method.
Subjunc is an RNA-seq read aligner that provides comprehensive detection of exon–exon junctions and reports full alignments of junction-spanning reads in BED file format.
First part is mapping a large number of 16mer subreads from each read to the genome. This step detects exon–exon junctions and determines the major mapping location of the read. The second part undertakes a detailed local re-alignment of each read with the aid of collected junctions.
Subjunc function can detect exon–exon junctions de novo and to quantify expression at the level of either genes, exons or exon junctions.
The featureCounts function counts the number of reads or read-pairs that overlap any specified set of genomic features. It can assign reads to any type of genomic region. Regions may be specified as simple genomic intervals (promoter regions) or can be collections of genomic intervals (genes comprising multiple exons). Any set of genomic features can be specified in GTF, GFF or SAF file format. SAF is a Simplified Annotation Format with columns GeneID, Chr, Start, End and Strand.
FeatureCounts produces a matrix of gene-wise counts and can be used as input for gene expression analysis with limma, edgeR or DESeq2. Alternatively, a matrix of exon-level counts can be produced suitable for differential exon usage analyses using limma, edgeR or DEXSeq.
FeatureCounts outputs the genomic length and position of each feature as well as the read count, making it straightforward to calculate summary measures such as RPKM (reads per kilobase per million reads).
The exactSNP function calls SNPs for individual samples, without requiring control samples to be provided. It tests the statistical significance of SNPs by comparing SNP signals to their background noises.
The Limma-voom function performs differential expression analysis for pre-processed RNA-seq data (single channel experiments) with sample-specific quality weights when the library sizes are quite variable between samples or the presence of outlier samples is given. The output reports the top100 differentially expressed genes and a pdf document containing density plots from raw and filtered counts, plot about the Mean−variance trend and gives visual information about sample clustering.
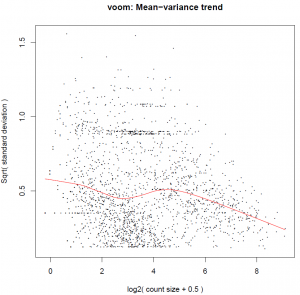
Figure 2 shows an example output of Limma-Voom method.
GeneXplain’s in-house implementation of a linear model analysis using Limma with experimental design specified through an annotation table. This tool performs linear model analysis on the given input table guided by selected experimental factors defined in a sample table. The analysis aims at finding significant differences between pairs of levels of a main factor. Furthermore, an ANOVA is carried out for all contrasts together. The assignment of main factor levels to columns of the input table is specified in a column of a sample table. Additional variables can be controlled by providing their column names in the sample table. Moreover, Surrogate Variable Analysis can be included to infer unspecified factors.
HISAT is a very fast and sensitive alignment tool for mapping next-generation sequencing reads (DNA and RNA) to a population of human genomes (as well as to a single reference genome). HISAT2 uses a large set of small GFM indexes that collectively cover the whole genome (each index representing a genomic region of 56 Kbp, with 55,000 indexes needed to cover the human population). These small indexes (called local indexes), combined with several alignment strategies, enable rapid and accurate alignment of sequencing reads. This new indexing scheme is called a Hierarchical Graph FM index (HGFM).
HISAT provides several alignment strategies specifically designed for mapping different types of RNA-seq reads. All these together, HISAT enables extremely fast and sensitive alignment of reads, in particular those spanning two exons or more. As a result, HISAT is much faster (over 50 times) than TopHat2 with better alignment quality. HISAT uses the Bowtie2 implementation to handle most of the operations on the FM index. In addition to spliced alignment, HISAT handles reads involving indels and supports a paired-end alignment mode. HISAT outputs alignments in SAM format.
This tool takes an alignment file in SAM or BAM format and feature file in GFF format and calculates the number of reads mapping to each feature. It uses the htseq-count script that is part of the HTSeq python module.
A feature is an interval (i.e., a range of positions) on a chromosome or a union of such intervals. In the case of RNA-Seq, the features are typically genes, where each gene is considered here as the union of all its exons. One may also consider each exon as a feature, e.g., in order to check for alternative splicing. For comparative ChIP-Seq, the features might be binding regions from a pre-determined list.
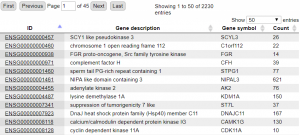
Figure 3 shows resulting table of calculated RNA-seq counts mapping to Ensembl genes as selected feature.
This tool takes a file with high-throughput sequencing reads (either raw or aligned reads) and performs a simple quality assessment by producing plots showing the distribution of called bases and base-call quality scores by position within the reads. Output is a PDF file with all quality plots.
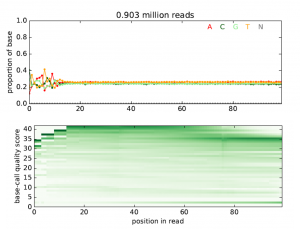
Figure 4 shows example output plots for the quality assessment from RNA-seq raw data.
Empirical Analysis of Digital Gene Expression Data in R (EdgeR)
Differential expression analysis of RNA-seq expression profiles with biological replication. Implements a range of statistical methodology based on the negative binomial distributions, including empirical Bayes estimation, exact tests, generalized linear models and quasi-likelihood tests. As well as RNA-seq, it can be applied to differential signal analysis of other types of genomic data that produce counts, including ChIP-seq, Bisulfite-seq, SAGE and CAGE.
The tool can be applied to any technology that produces read counts for genomic features. Of interest are summaries of short reads from massively parallel sequencing technologies such as Illumina™, 454 or ABI SOLiD applied to RNA-Seq, SAGE-Seq or ChIP-Seq experiments, pooled shRNA-seq or CRISPR-Cas9 genetic screens and bisulfite sequencing for DNA methylation studies. EdgeR provides statistical routines for assessing differential expression in RNA-Seq experiments or differential marking in ChIP-Seq experiments.
EdgeR can be applied to differential expression at the gene, exon, transcript or tag level. In fact, read counts can be summarized by any genomic feature. EdgeR analyses at the exon level are easily extended to detect differential splicing or isoform-specific differential expression.
This tool uses the edgeR quasi-likelihood pipeline (edgeR-quasi) for differential expression analysis. This statistical methodology uses negative binomial generalized linear models, but with F-tests instead of likelihood ratio tests. This method provides stricter error rate control than other negative binomial based pipelines, including the traditional edgeR pipelines or DESeq2. While the limma pipelines are recommended for large-scale datasets, because of their speed and flexibility, the edgeR-quasi pipeline gives better performance in low-count situations.
New miRNA features:
The miRNA feed forward loop is a combination of miRNA, a transcription factor and a target gene. The miRNA regulates expression of the target gene. The transcription factor regulates transcription of both: target gene and gene encoding the miRNA. This analysis accepts a list of miRNAs or a list of target genes or both and finds corresponding miRNA feed forward loops. Results can be visualized using ‘create miRNA diagram’ function.
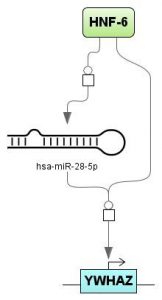
Figure 5 shows visualization of detected feed forward regulation from a miRNA (has-miR-28-5p) to his target gene (YWHAZ) and the involved transcription factor HNF-6.
Analyze miRNA target enrichment
This tool takes a set of human genes as input and searches for miRNA target enrichment with the help of our in-house TargetScan database. The resource comprises miRNA/target gene links for human based on conserved miRNA site prediction from TargetScan.
This tool provides from a given list of human miRNAs their potential miRNA target genes with the help of our in-house TargetScan database.
This tool creates a track (promoter sequence collection) from a list of given miRNAs.
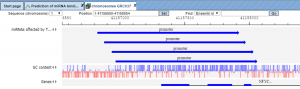
Figure 6 shows visualization of promoter sequences from human genome version hg19 with the geneXplain genome browser.
More new features:
This method uses the result of a CRC (Chinese Restaurant Clustering) analysis and extracts most centered cluster items into a separate table. More detailed, it sorts clusters by size, takes top Maximum number of clusters to use with size greater than Min items per cluster and extracts Max items per cluster items closest to the center of cluster.
This method checks project disk space usage and corrects it with deleting temporary used disc space if necessary.
This method filters duplicate rows from the input table and gives a non-redundant output.
This method helps to group selected rows from the input table. Output will contain a table with the number of counts of the selected rows.
This method merges several columns of a table into one column using a selected aggregator.
This method creates a pie chart using a category column and a leading column for a visual evaluation and comparison of the results. Colors for the different segments of the pie chart can be customized using the color palate.
This method creates a bar chart using a category column and leading column for a visual evaluation and comparison of the results. Colors for the different segments of the plot bar chart can be customized using the color palate.
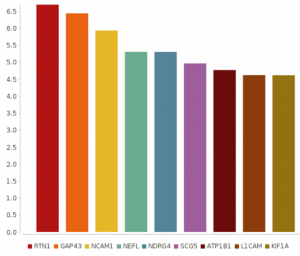
Figure 7 shows a plotted bar chart with default color scheme.
This method selects random rows from the input table to create a randomized output table based on the selected random number of rows and percentage.
This method selects top rows based on the selected parameter from the input table. The rows can be selected as top, middle or bottom types from the input table.
This method allows to annotate columns in the input table from another user defined input table(s). It can use more than one table as the source table to annotate different columns in the input table.
This method changes/transforms the input table based on the selected operation. It can add the selected operation (log2, log 10, Pow2, Pow10, exp) to the input table.
Tree map on functional classification
This analysis (REVIGO) was adapted and allows a tree map visualization of functional classification results to reduce Gene Ontology terms and based on the p-value cut-off.
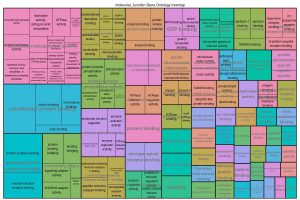
Figure 8 presents the results of a Tree map analysis, which gives a visualization of reduced GO terms from a functional classification analysis.
This method compares the structures of two diagrams based on the input parameters and gives different entries within the resulting diagram.
This analysis creates clones of selected nodes (protein names) for each its edge. It can be used to focus on main interesting regulatory proteins and visualize results in the output clone diagram.
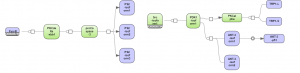
Figure 9 presents the results of the Get molecules from diagrams method.
This method creates promoter regions based on an input gene list (and based on Chip-seq peaks located near the TSS if peaks are present). On top information from CAGE database (FANTOM5) about most active TSSs in specific tissues or cell type can be used and promoter length to be extracted can be defined. The result of this analysis can be used as input track for Site search analysis.
This analysis separates an input VCF file into two sets: Yes-set – sites that do overlap with the regulation track (= Out yes), No-set – sites, that do not. If the No-set contains less sites than defined in the Min no size parameter (default = 100), random tracks from Default VCF will be added to the No-set (=Out no).
Motif Score Association Test (MSAT) is a tool to test for association between a motif score and a quantity of interest using generalized linear models (glms).
For each TFBS motif of a specified profile, scores are calculated for promoter sequences of input genes. R’s glm methodology is then applied to model the quantity of interest given with the input genes as dependent variable or response (y) and motif scores as independent variable or predictors (x):y=f(x).
For each motif the tool reports the estimated coefficient (slope) as well as its unadjusted and adjusted p-values, where it is assumed that the results are most suitably ranked by (unadjusted or adjusted) p-values.
Construct composite module on tracks with keynodes
Predicts composite module as Construct composite modules on tracks method AND uses Regulator search analysis during calculating score of the composite module (score is used to select the best module). Regulator search finds master-regulators which affect transcription factors included in the modules.
Construct composite modules with keynodes
Predicts composite module as Construct composite modules method AND uses Regulator search analysis during calculating score of the composite module (score is used to select the best module). Regulator search finds master-regulators which affect transcription factors included in the modules.