TRANSFAC basic
The biggest and most comprehensive database on gene regulation
It’s been almost 35 years since the date of first TRANSFAC® database publication, and since then this biggest collection of transcription factors and their genomics binding sites has served to the scientific community as the most reliable and comprehensive resource for gene regulation studies.
TRANSFAC® includes information on over 48,000 transcription factors and their genomics binding site models (PWMs – positional weight matrices) for a variety of eucaryotic species.
The detailed statistics of TRANSFAC® database contents can be found here.
For more details, visit the TRANSFAC® product page >>>
TFBS prediction in eukaryotic DNA sequences (Match, FMatch, CMsearch) interface
The TRANSFAC® database provides a wide variety of tools for predicting transcription factor binding sites (TFBS) in the studied DNA sequences. In the portal interface of the TRANSFAC® database you will find the Match, FMatch, and Composite Model analysis tools for TFBS prediction under the Tools menu button:
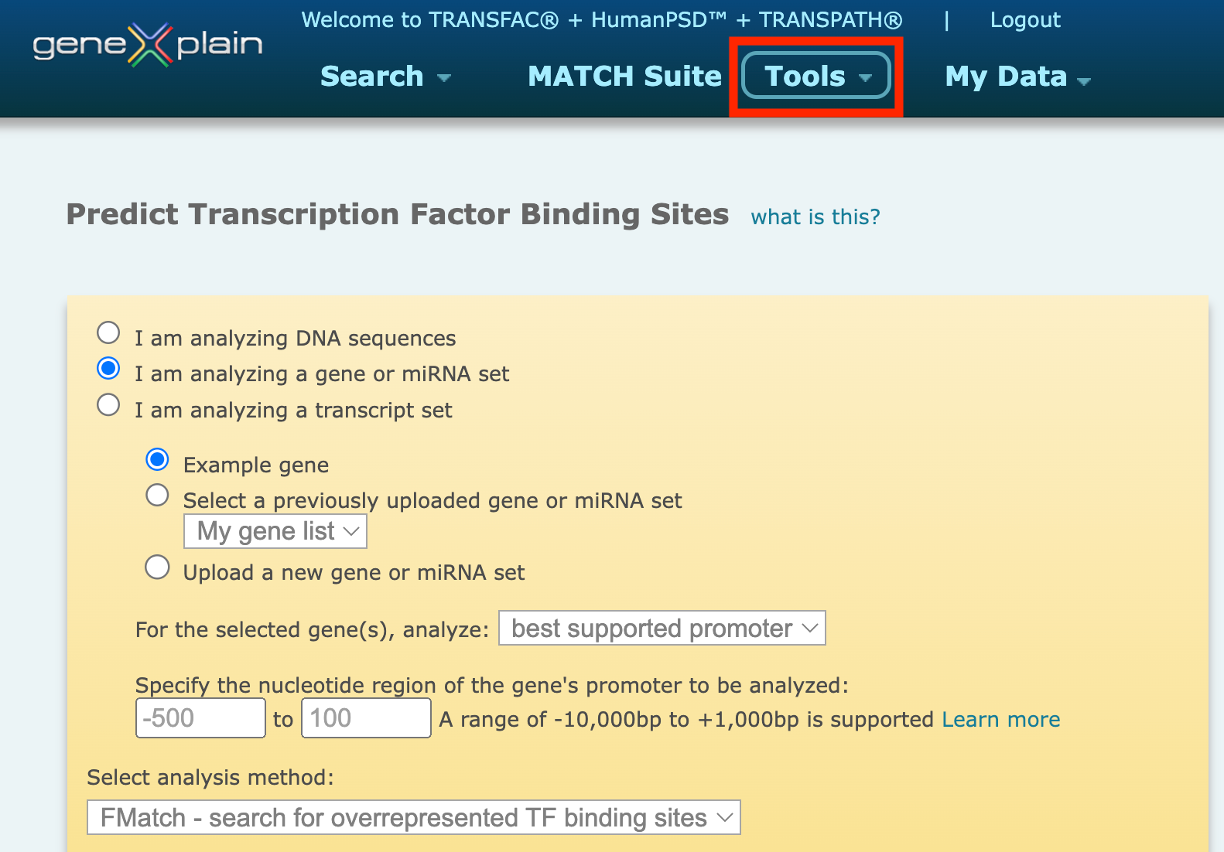
1. Match – search for TF binding sites
This option uses the Match algorithm, in combination with a selected profile containing a list of matrices and their assigned cut-offs to search for individual transcription factor binding sites that meet the specified cut-offs.The Match option is recommended when the broadest set of results is desired.
2. Composite model – search by pairs of TFs
This option uses the Composite Model algorithm, in combination with a selected model or models which represent pairs of transcription factors known to act together to coordinately control gene regulation, and their assigned cut-offs to search for pairs of transcription factor binding sites that meet the specified cut-offs.The Composite Model option is recommended when specific information about coordinate regulation is known, or when more stringent results are desired.
3. FMatch – search for overrepresented TF binding sites
This option is used to find sites which are overrepresented in a set of analyzed sequences (e.g. promoters from differentially expressed genes or ChIP-Seq fragments) in comparison to a background set (e.g. promoters from genes whose expression did not change under the same conditions or random sequences).
Predicting transcription factor binding sites in a DNA sequence involves several steps:
- Select DNA sequence(s)
- Select the analysis method
- Select a profile (group of matrices) or model (pair of matrices)
- Set optional parameters
- Start the search
Match in the geneXplain portal interface accepts the following DNA sequence formats as input: FASTA, GenBank, EMBL and RAW.
Alternatively, a new sequence via genomic coordinates in the .bed format can be uploaded. This input format is supported for human (hg38/GRCh38), mouse (mm39/GRCm39), rat (rn6/RGSC 6.0), pig (Sscofa11.1), macaque (Mmul8.0.1), Arabidopsis (TAIR10), and fruit fly (BDGP6) genomes.
The geneXplain portal Match tool also accepts gene or miRNA set as the input for TFBS prediction analysis. Еhe option to upload a list of genes or miRNAs for binding site prediction is available for those organisms, for which promoter sequences are provided in TRANSFAC database, namely: Human, Mouse, Rat, Arabidopsis thaliana, Soybean, Rice, Pig, Macaca mulatta, Drosophila, Dog, Chimpanzee, and Plasmodium falciparum 3D7.
The results of Match, FMatch and Composite Model analysis are presented in the respective analysis report which is comprised of three sections: Analysis summary, Matrix summary, and Sequence summary.
Analysis summary
The Analysis summary section provides an overview of the count of sequences analyzed, the number of sites found, etc. In the FMatch Analysis Report the Analysis Summary contains a summary on the Experimental data set, as well as a summary on the Background data set.
Matrix summary (Match, FMatch), Model summary (Composite Model)
For Match results, the Matrix summary section provides an overview of the matrices for which at least one binding site was predicted:
When available, additional info is provided on the experimental support of the possible biological connection between the factor and the gene. The total number of binding sites predicted for the matrix across all sequences within the analysis is shown in the Sites column on the Matrix summary table. The Sequences column refers to the number of sequences within the sequence set for which at least one binding site was predicted for the matrix. The value in the Sites per sequence column provides the average number of binding sites predicted for the matrix per sequences within the sequence set.
For Composite Model results, the Model summary section provides an overview of results for each model considered in the analysis:
The Sites column in this table provides the count of total binding sites predicted for the model across all sequences within the analysis. The Sequences column provides the count of sequences within the sequence set for which at least one binding site was predicted for the model. The Sites per sequence column provides the average number of binding sites predicted for the model per sequences within the sequence set.
For FMatch results, the Matrix summary section provides an overview of the matrices for which at the optimized cut-offs the over- or underrepresentation of sites in the experimental data set versus the background data set fit the p-value threshold:
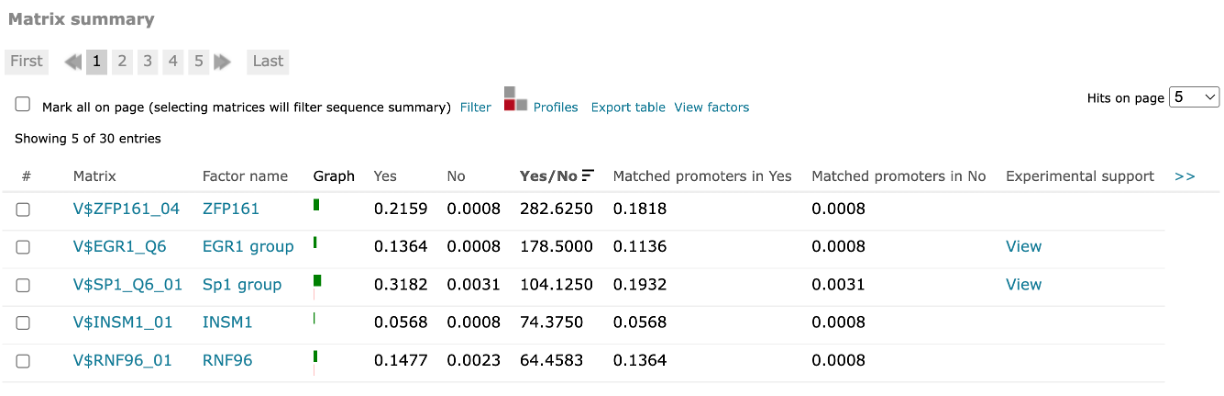
The Graph column displays the relative number of sites for the selected matrix in the experimental data set (green bar) versus in the background set (red bar). The Yes and No columns contain the relative number of sites for the selected matrix in the experimental data set and the relative number of sites for the selected matrix in the background data set respectively. The Yes/No ration column shows the relative number of sites for the selected matrix in the experimental data set divided by the relative number of sites in the background data set. The Matched promoters in Yes and Matched promoters in No columns show the relative number of sequences/promoters in the experimental data set with at least one site for the selected matrix and the relative number of sequences/promoters in the background data set with at least one site for the selected matrix respectively.
Sequence summary
For Match and FMatch results, the Sequence summary section provides, for each sequence analyzed, a graphical display of the predicted binding sites and a tabular summary. In the Sequence Summary of the FMatch Report, you can switch between the Experimental set and the Background set.
If more than one sequence was submitted for analysis, a click on the sequence name would view the binding sites graphical display and tabular summary. If only one sequence was submitted for analysis, the view will open automatically.
The Position (strand) column indicates the starting position of the match in the input sequence and the strand, (+) or (-), on which it can be found. In case of analyzed genomic intervals or promoter sequences submitted from TRANSFAC, genomic coordinates are provided. The Core score column indicates the score for core similarity (core match). The Matrix score column indicates the score for matrix similarity (matrix match). The Sequence column identifies the portion of the input sequence that was identified as the binding site. Capital letters indicate the positions in the sequence that match with the core sequence of the matrix, while the lower case letters refer to positions which match to other parts of the matrix. When available, experimental support info is provided, which lists supporting lines of evidence from the scientific literature supporting a possible biological connection between the factor and the gene.
In the graphical output, the predicted sites are shown as arrows above the respective part of the sequence with the factor name printed within the arrow:
A click on the arrow will open a pop-up window with the binding site information summary and a hyperlink to the corresponding Matrix Report.
When the genomic coordinates of the analyzed sequences are known either via .bed coordinate upload or via the use of stored TRANSFAC promoters, the binding sites predicted with Match, CMsearch or FMatch can be filtered by intervals from the database of ChIP fragments (Binding fragments for transcription factors from ChIP-seq or similar experiments), DNase hypersensitivity sites or Phastcons intervals (intervals of conservation, as determined by 46-way phastcons and 60-way phastcons placental mammals tracks for human and mouse at UCSC ). The location of the selected intervals/features is displayed by color-coded bars underneath the analyzed sequence and gray lines in the frequency bar. When one of these features is selected, all hits outside the respective intervals are excluded from the result. When more than one feature is selected at the same time, all hits outside the intersection of the intervals are excluded from the result. For the filtering, the matrix (and model) hits are allowed to extend up to three nucleotides outside the intervals.
For Composite Model results, the Sequence summary section provides, for each sequence analyzed, a graphical display of the predicted binding sites and a tabular summary:
If more than one sequence was submitted for analysis, a click on the sequence name would view the binding sites graphical display and tabular summary. If one sequence was submitted for analysis, the view will open automatically.
The columns Matrix 1 and Matrix 2 identify the respective matrix and either provide a hyperlink to the corresponding TRANSFAC Matrix Report or, in the case of user-defined matrix, display the name of the user matrix. Columns Sequence 1 and Sequence 2 identify the matching sequence. Capital letters indicate the positions in the sequence that match with the core sequence of the matrix, while the lower case letters refer to positions which match to other parts of the matrix. Columns Position (strand 1) and Position (strand) 2 indicate the starting position of the match in the input sequence and the strand, (+) or (-), on which it can be found. The columns Matrix score 1 and Matrix score 2 indicate the score for matrix similarity (matrix match). The column Model provides the name of the model.
The obtained results can be saved to the geneXplain portal cloud storage using the “Save this report” link at the top of the analysis report, or dowloaded to the local computer using the “Export this report”.
More information on TFBS search in the geneXplain portal interface can be found in the “Gene Regulation Analysis Tools” –> “Predicting TF-Binding Sites” section of the portal user guide.
Analysis of human genes for tissue- and GO-specific transcription factors (MATCH Suite)
In addition to the powerful classic geneXplain portal Match approach towards TFBS prediction, which is widely described on this page, the TRANSFAC 2.0 provides its users with the MATCH Suite tool for human genes analysis, which comprehensively addresses the syntax and semantics of gene regulation and allows you to identify the transcription factors regulating the gene(s) of your interest.
MATCH Suite can be launched immediately from the search results in the geneXplain portal interface:
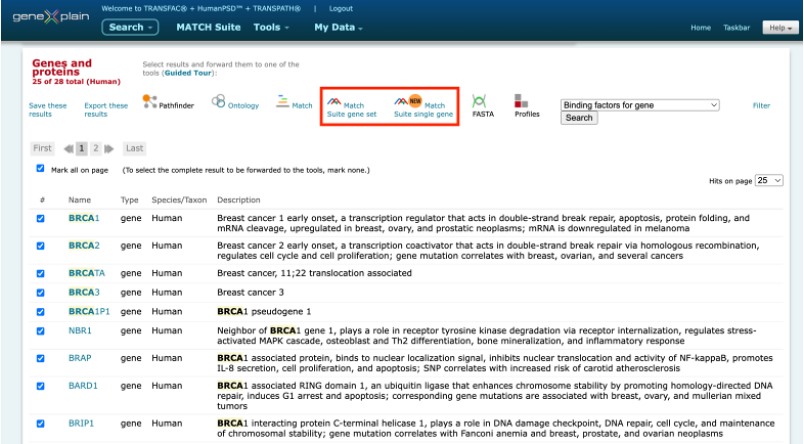
It can be also launched from a user-specified gene or gene set (from 20 to 2000 genes) in the gene symbol, Ensembl ID, or Entrez ID formats.
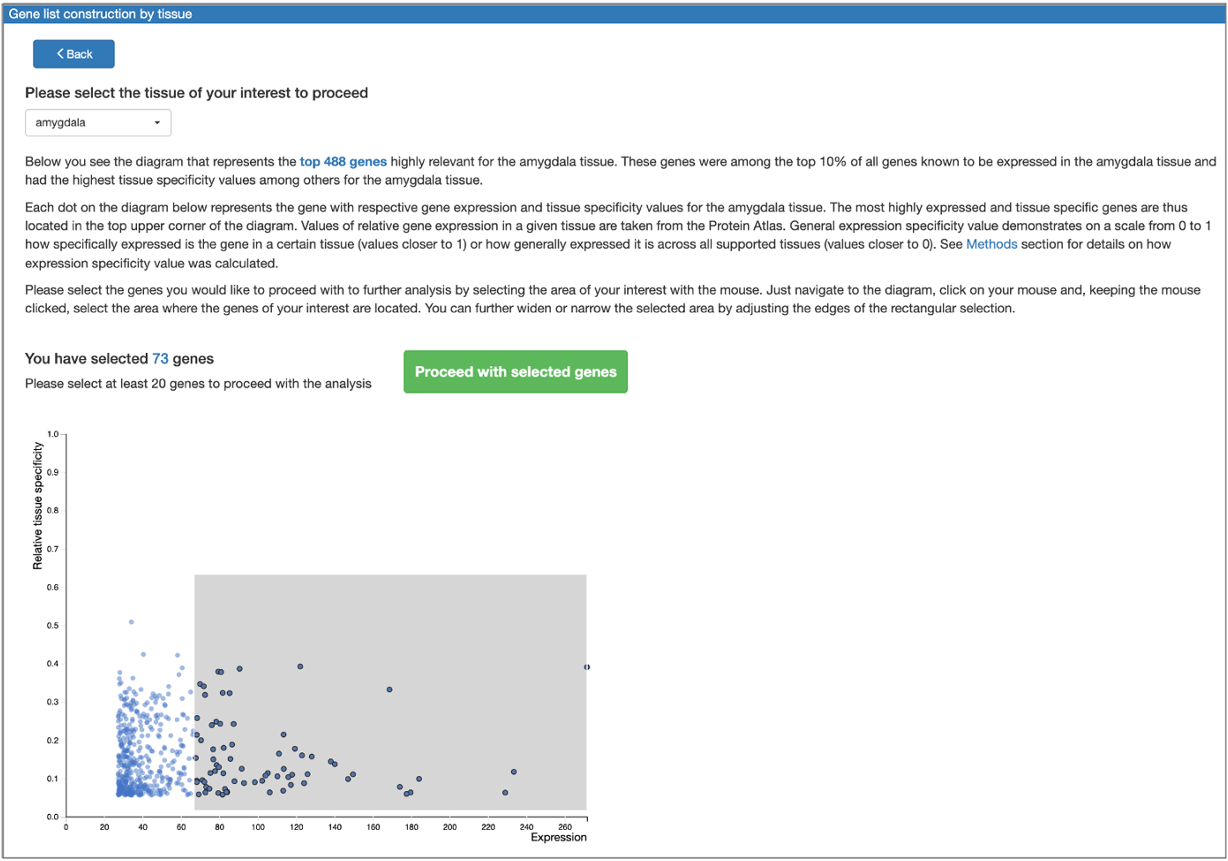
The tool also provides an option to construct a tissue-specific gene list from scratch:
Gene(s) selected for analysis can be then submitted to the search for transcription factors responsible for their regulation. The resulting transcription factors can be pre-filtered to those representing the genes belonging to certain GO categories, or to those expressed in a given tissue. Gene list optimization in terms of selected GO categories belonging and expression in a given tissue can also be performed.
As the result of analysis, MATCH Suite provides a downloadable report and interactive results visualization interface with a variety of on-the-fly filters that can be applied to the received results. You can view the demo report of MATCH Suite single gene analysis or the demo report of the MATCH Suite gene set analysis for further details. Examples of main results visualizations are provided below.
Gene set analysis
The interactive results visualisation section of the MATCH Suite provides you with dynamically filterable tables of the eventually identified TFs and respective matrices (binding models). The genes from the input set are compiled to a dynamically updating table, which demonstrates the regulation of these genes by respective TFs and binding motifs. Interactive genome browser visualisation of the identified sites in the promoters of your input genes is providing intuitive overview of the obtained results and various customisable filters applied.
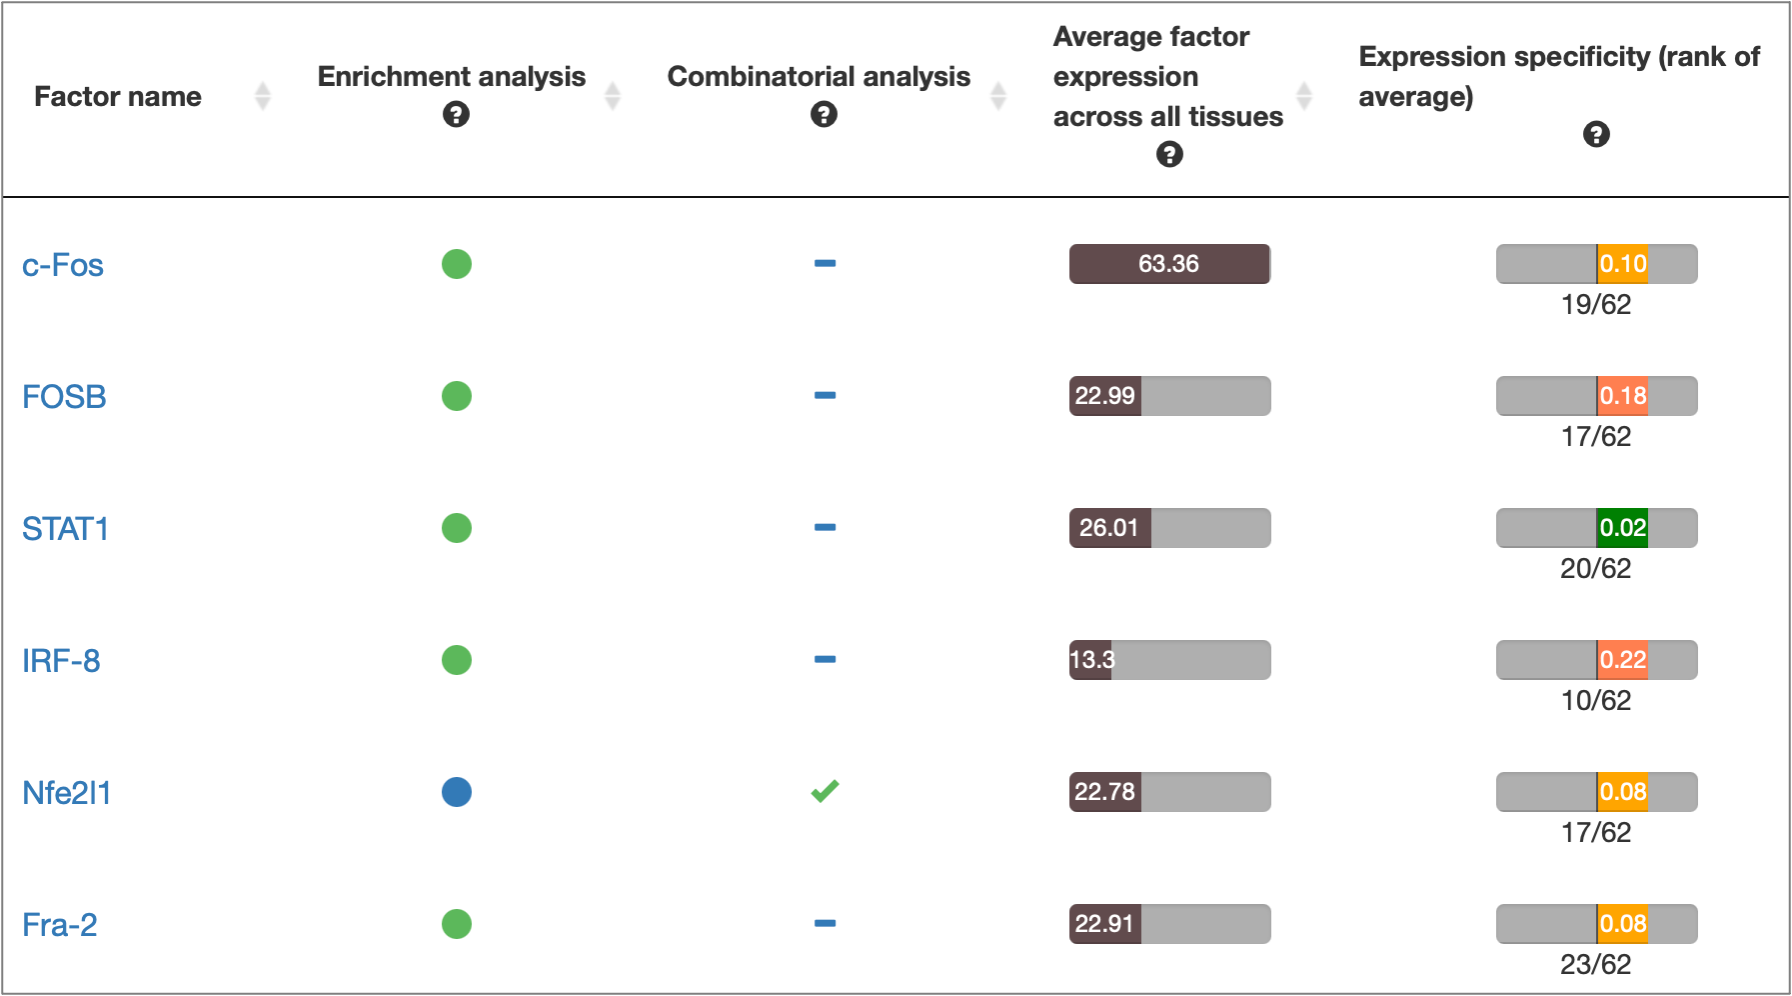
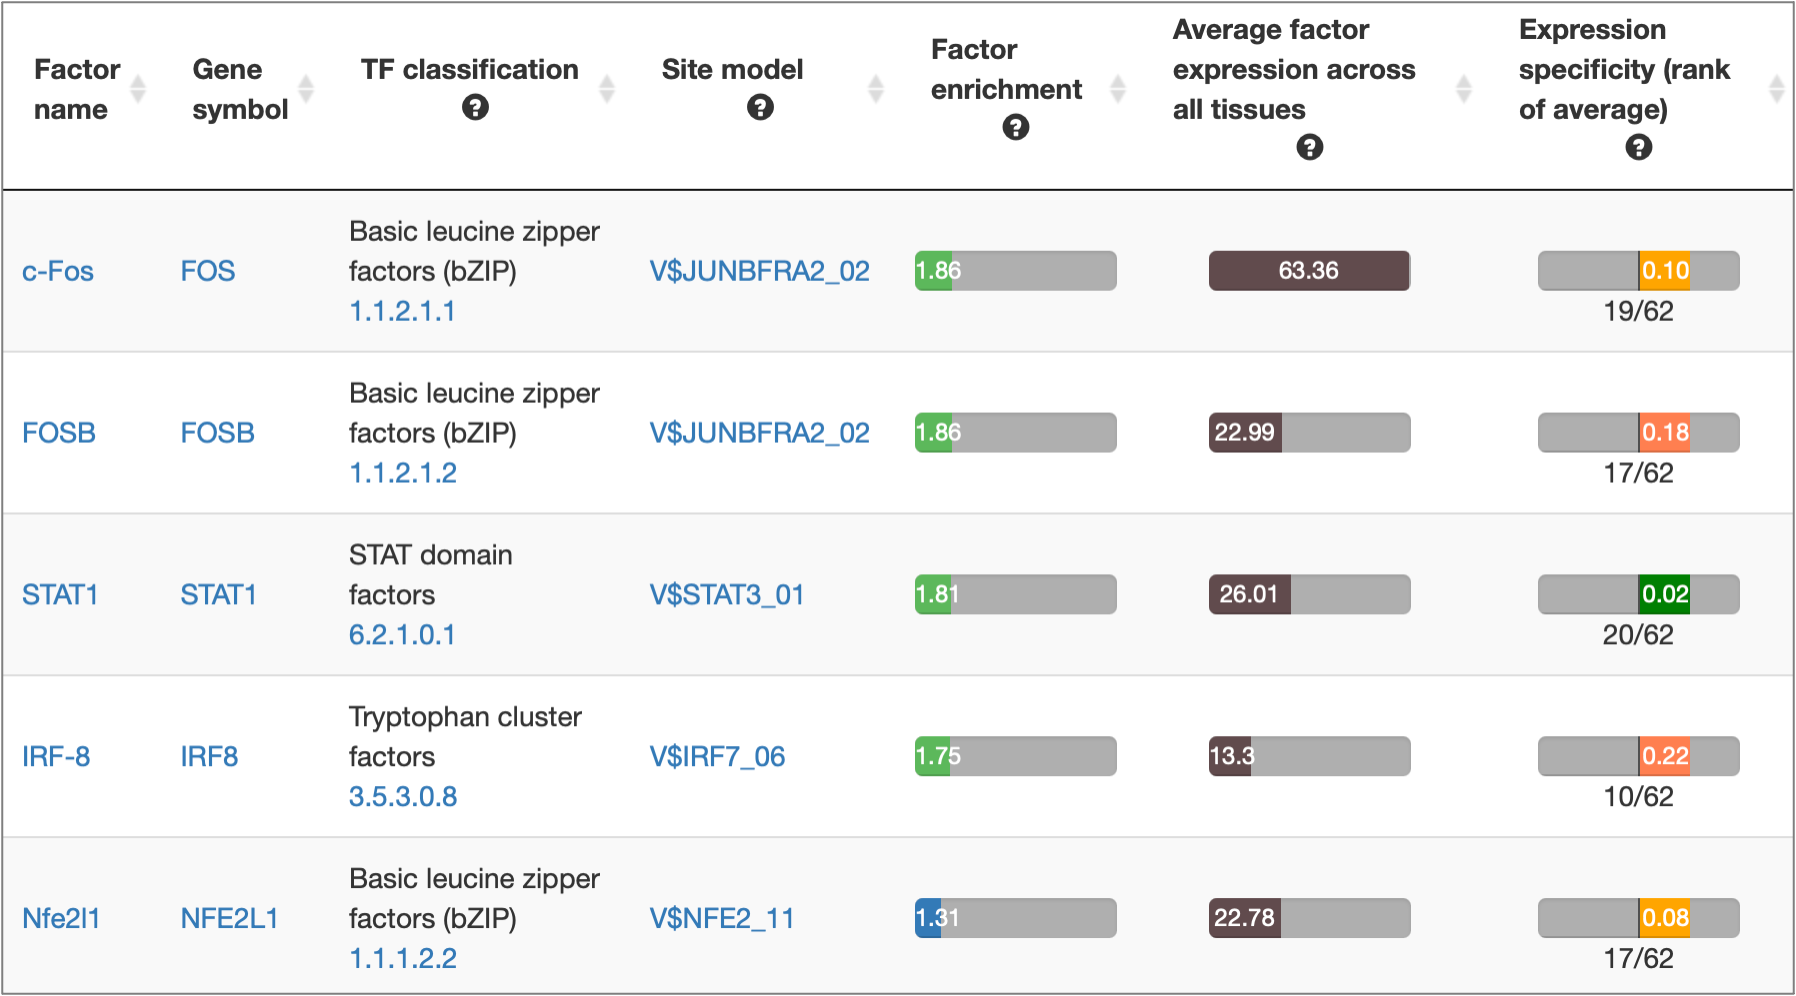
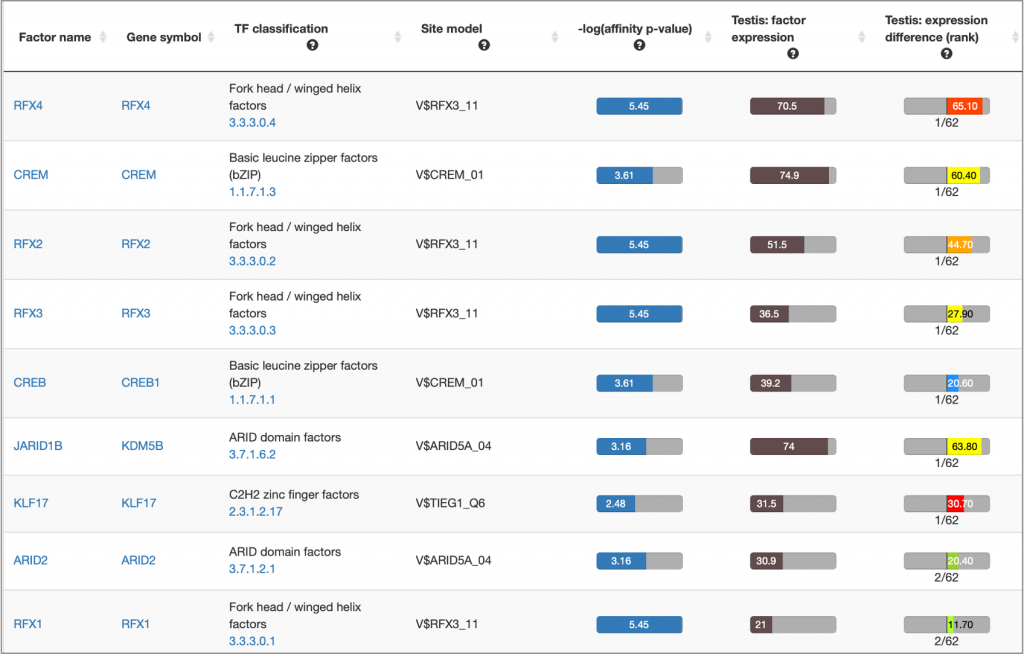
MATCH Suite gene set analysis result: Factor Overview table example:
MATCH Suite gene set analysis result: Factor Pro table example:
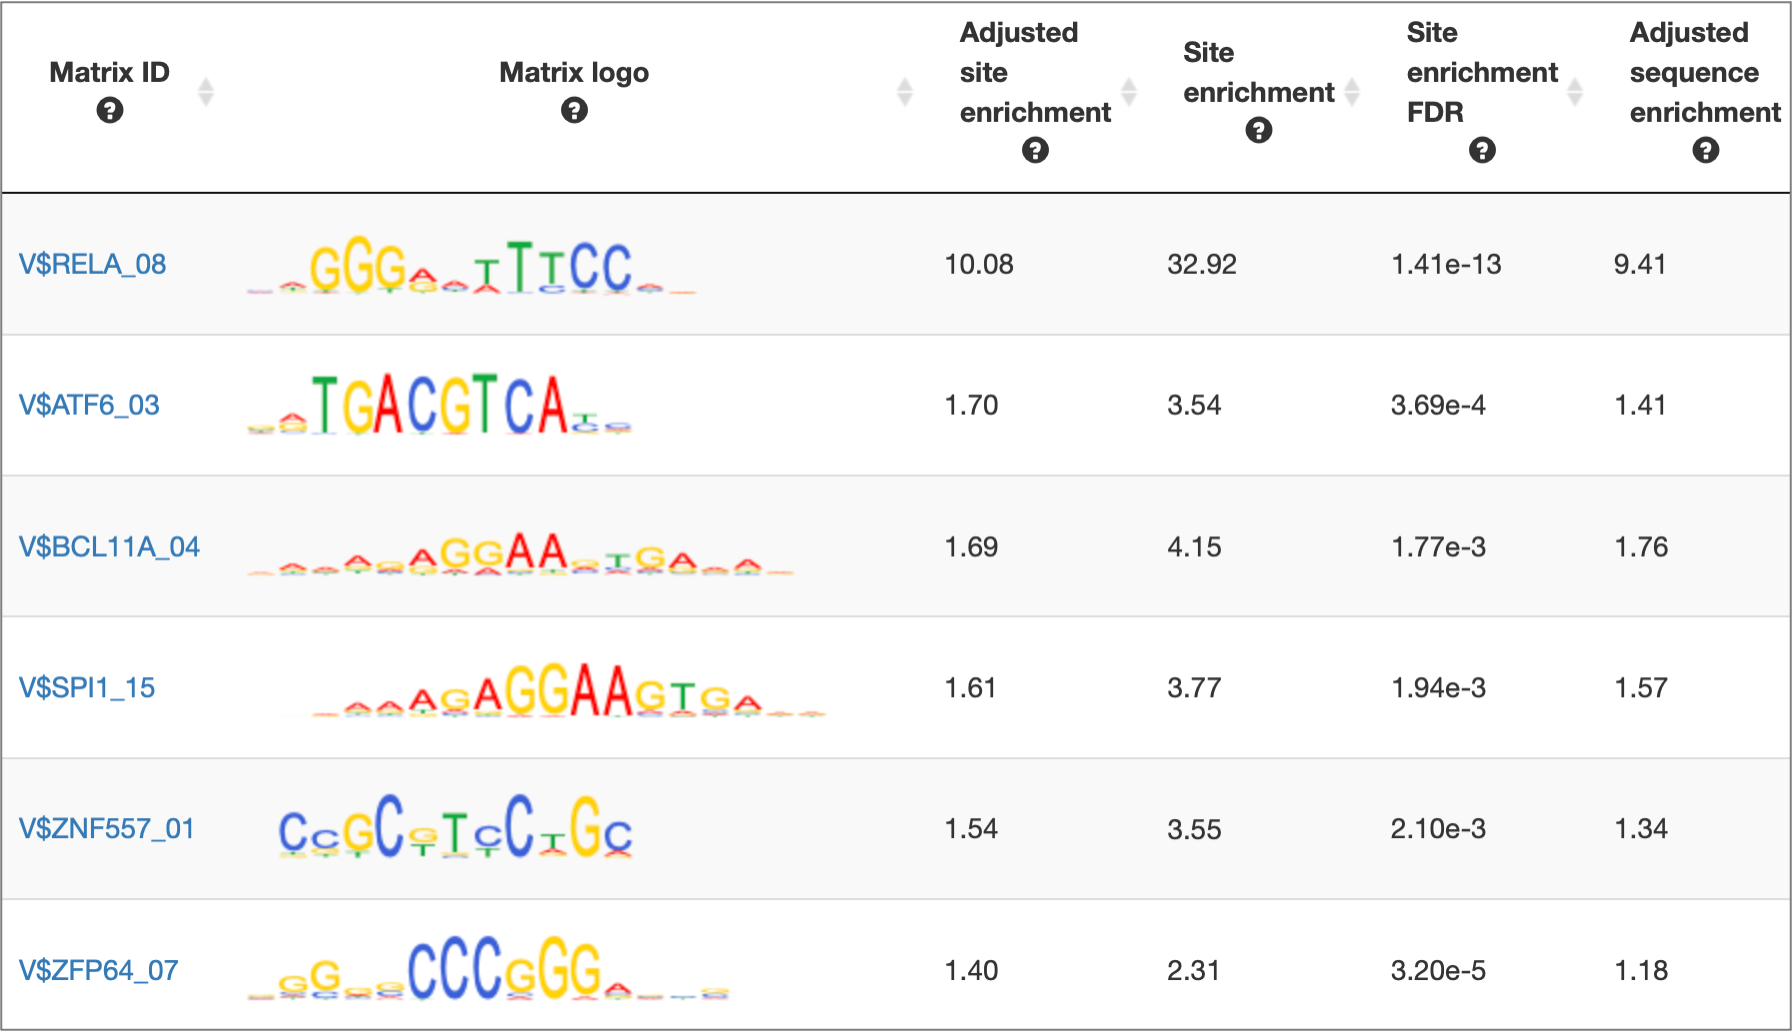
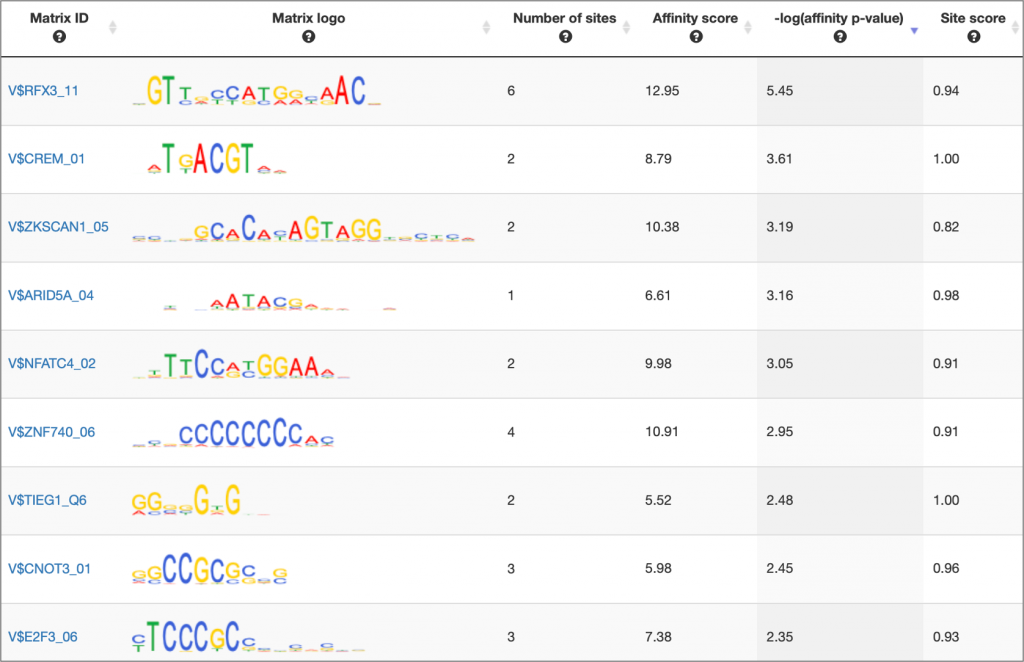
MATCH Suite gene set analysis result: Matrix table example:
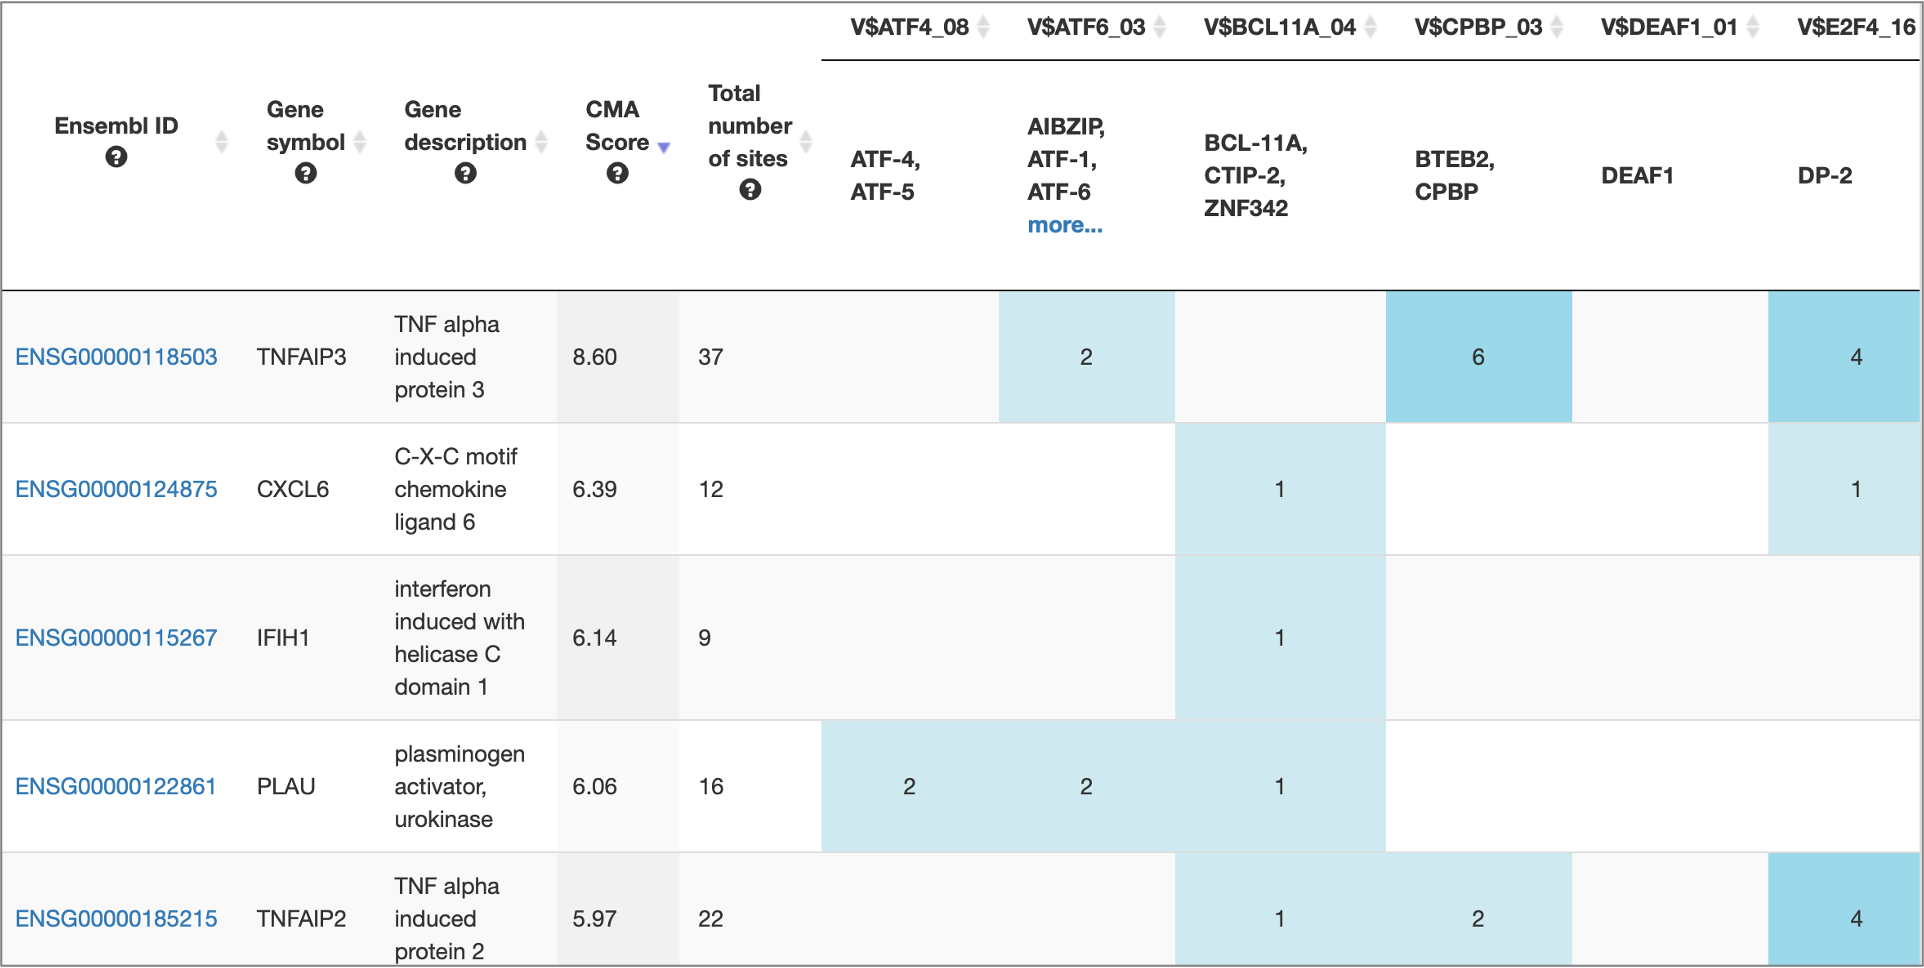
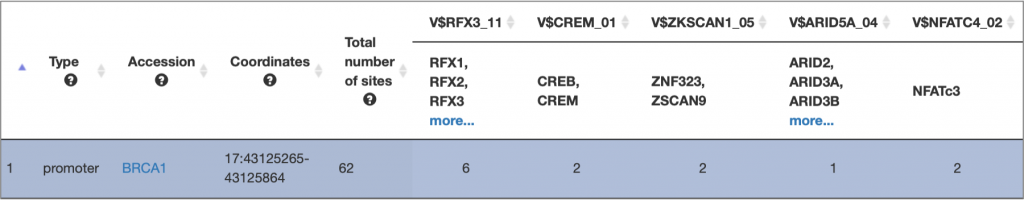
MATCH Suite gene set analysis result: Genes table example:
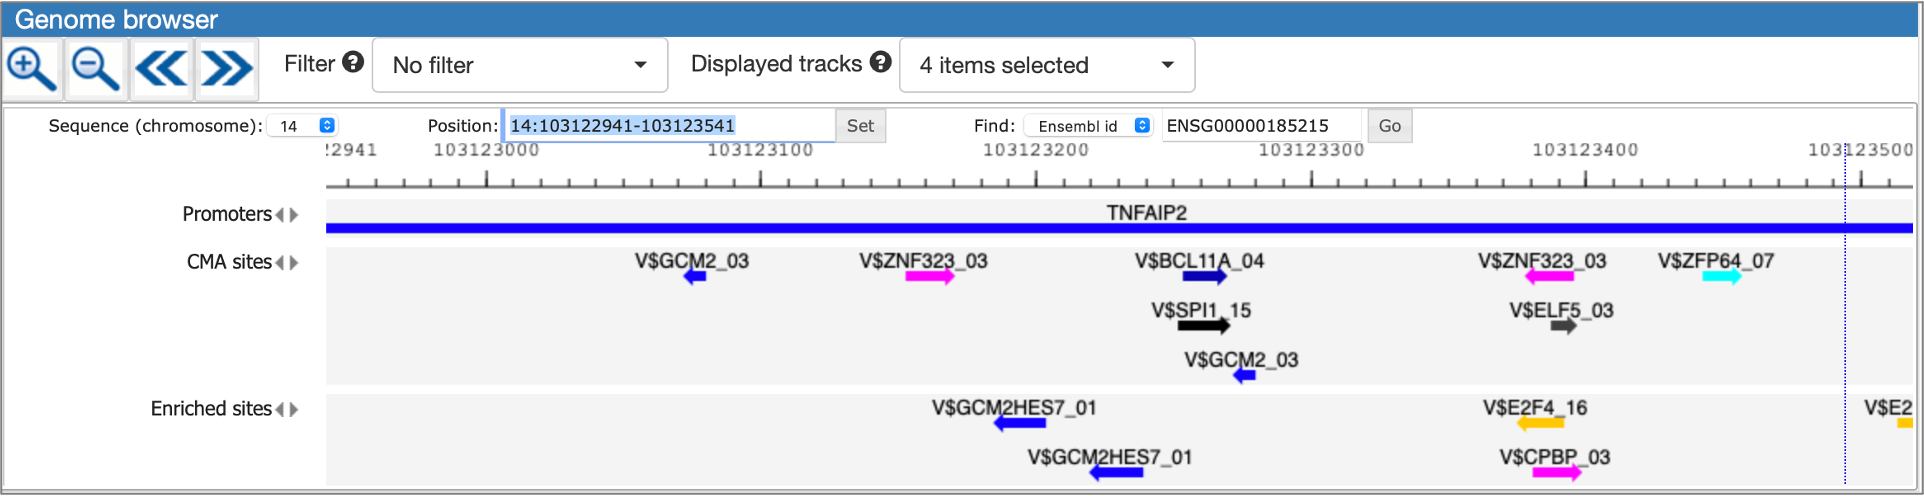
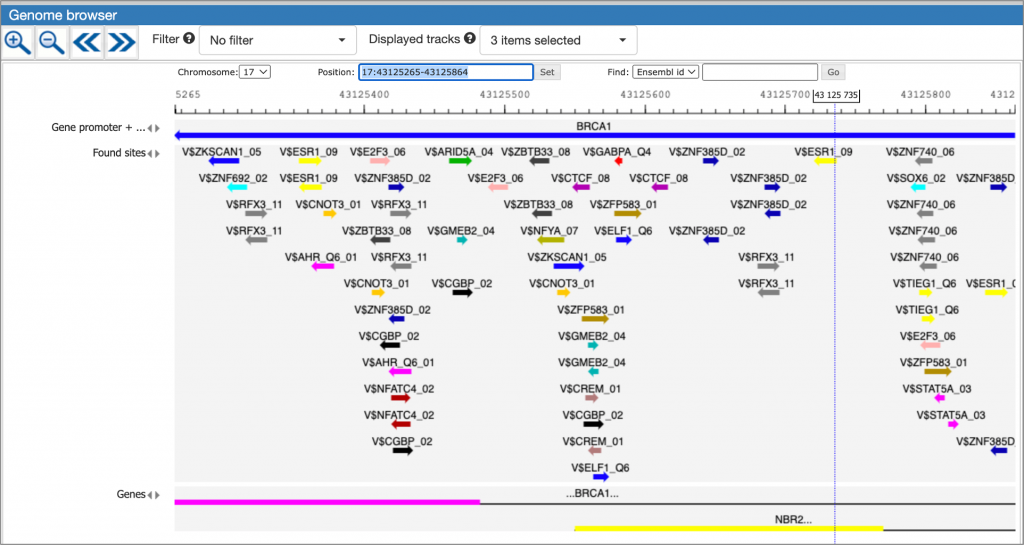
MATCH Suite gene set analysis result: Genome browser visualisation example:
Single gene analysis
The interactive results visualisation section of the MATCH Suite provides you with dynamically filterable tables of the eventually identified TFs and respective matrices (binding models). The regulatory regions of the input gene (promoters and enhancers/silencers) are compiled to a dynamically updating table, which demonstrates the regulation of these regions by respective TFs and binding motifs. Interactive genome browser visualisation of the identified sites in the regulatory regions of your input gene is providing intuitive overview of the obtained results and various customisable filters applied.
MATCH Suite single gene analysis result: Factor table example:
MATCH Suite single gene analysis result: Matrix table example:
MATCH Suite single gene analysis result: Regulatory regions table example:
MATCH Suite single gene analysis result: Genome browser visualisation example:
A much more detailed description of MATCH Suite interface, as well as results interpretation guidance, can be found in the MATCH Suite user guide.
The full description of algorithms applied behind the MATCH Suite analysis can be found in the Methods single gene analysis and in the Methods gene set analysis documents.