Tools
(incl. all tools of TRANSFAC BASIC)
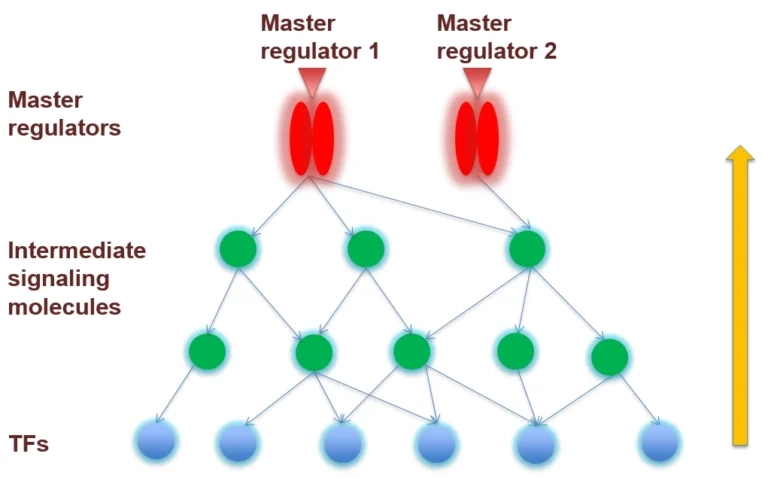
The collected signal transduction networks can be used by the included tools for pathway analysis, particularly, in connection with TF-DNA binding motifs, this allows upstream analysis as integrated promoter-network analysis, whereby the TFs of in step 1 predicted TFBSs are used as starting point for finding master regulators in step 2 converging upstream of the transcription factors.
Pathways analysis
What is Pathway Analysis?
Most commonly, it is of interest to know which signaling or metabolic pathways are activated under certain experimental conditions.
A slightly different question may be to find out which pathways were used to express a certain observed phenotype.
Both types of problems can be conveniently addressed with our tools provided by TRANSFAC PATHWAYS package.
Approaches to pathway analysis
To find out whether among all genes induced in an experiment those are overrepresented that encode components of a certain pathway, conventional gene set enrichment analysis (GSEA) and related methods can be applied. In such an approach, however, topological information about the pathway is lost.
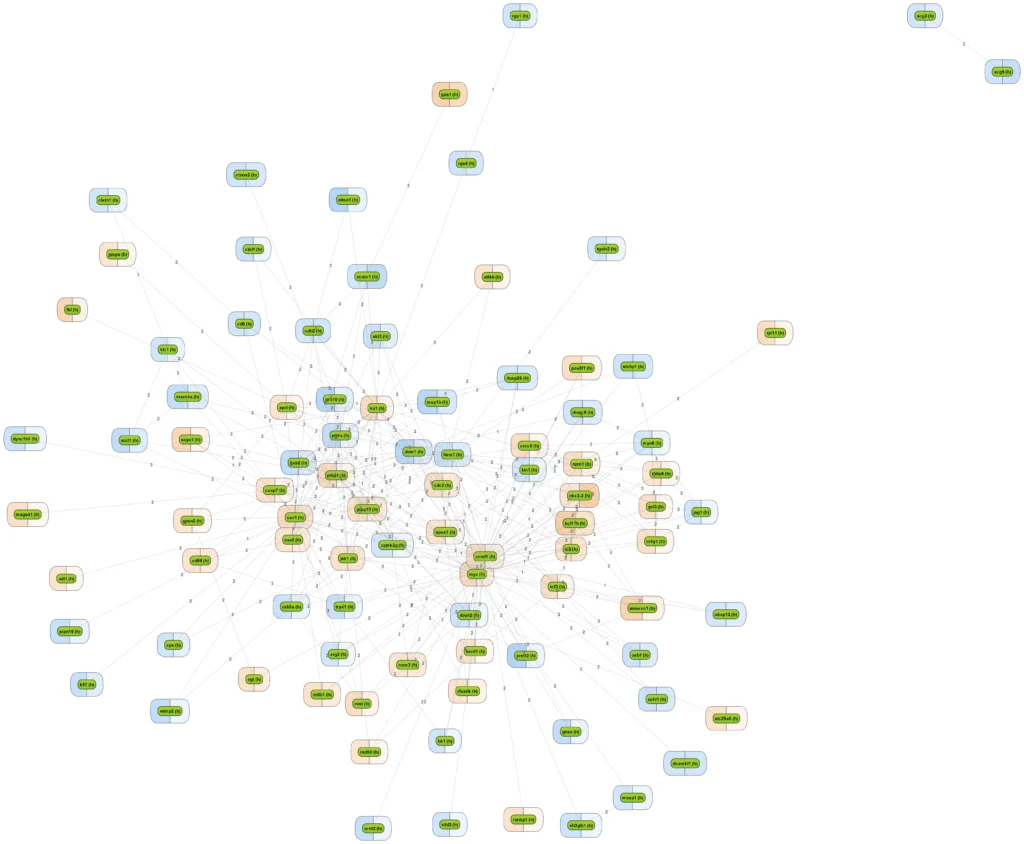
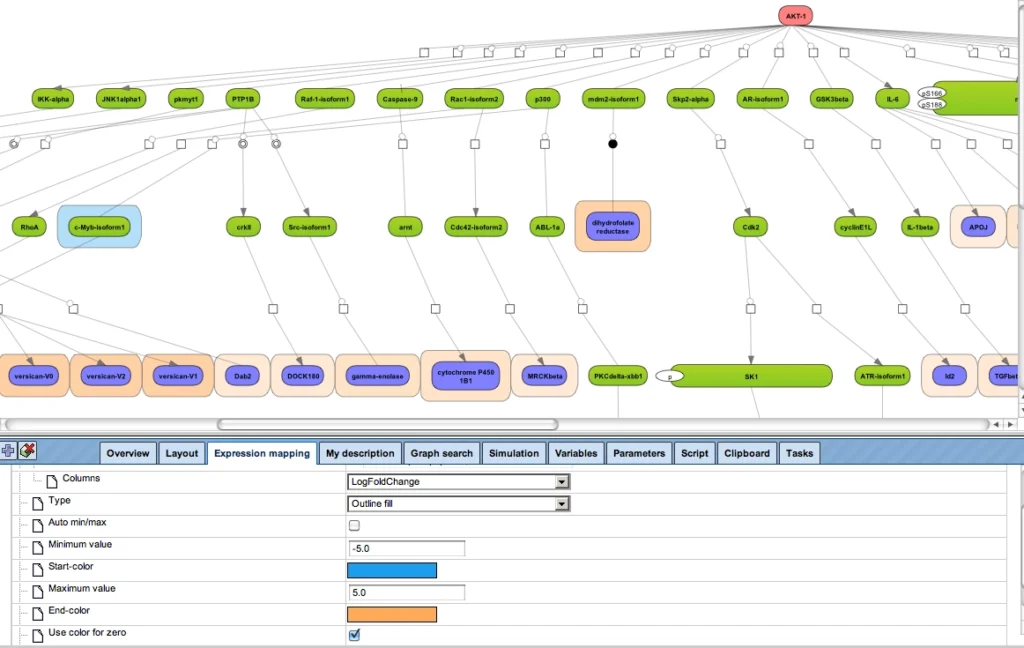
More sophisticated is to search for those networks, pathways or paths where many linked components have been induced. This is provided by the platform option “Cluster by shortest path”. A visualization of differential expression onto a known pathway is shown in the figure below. These known pathways may be documented in the databases TRANSPATH® (manually curated information; example shown) or GeneWays (compiled by text mining).
Learn more about the geneXplain platform.
When starting from a set of differentially expressed genes or their products, resp., it is frequently of interest to see what is their common activator. Such convergence points of upstream pathways are potential master regulators, or key nodes.
The next figure shows how the upstream paths of a set of proteins (blue) converge in one master regulator (here: AKT1, red). The database behind this analysis is TRANSPATH®. It can be seen how a section of the whole pathway (overview in the lower right window) is amenable to editing in the main work area. Detailed information about a selected component, like the mTor complex in this example, are displayed in the Info Box at the lower left corner.
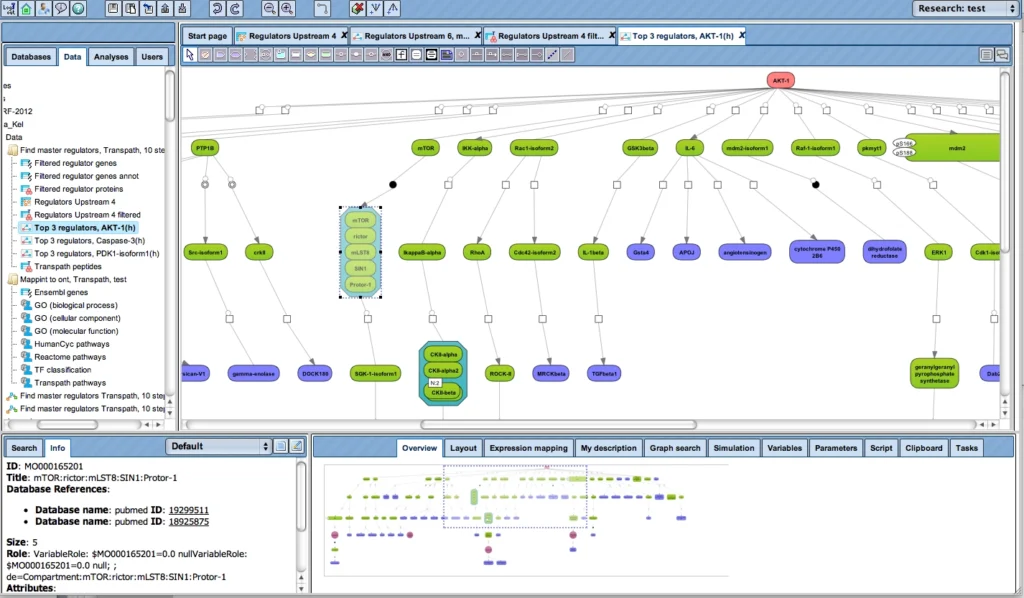
This type of analysis can be combined with the visualization of differentially expressed genes and their expression behavior, in the same way as shown above.

Graph layout
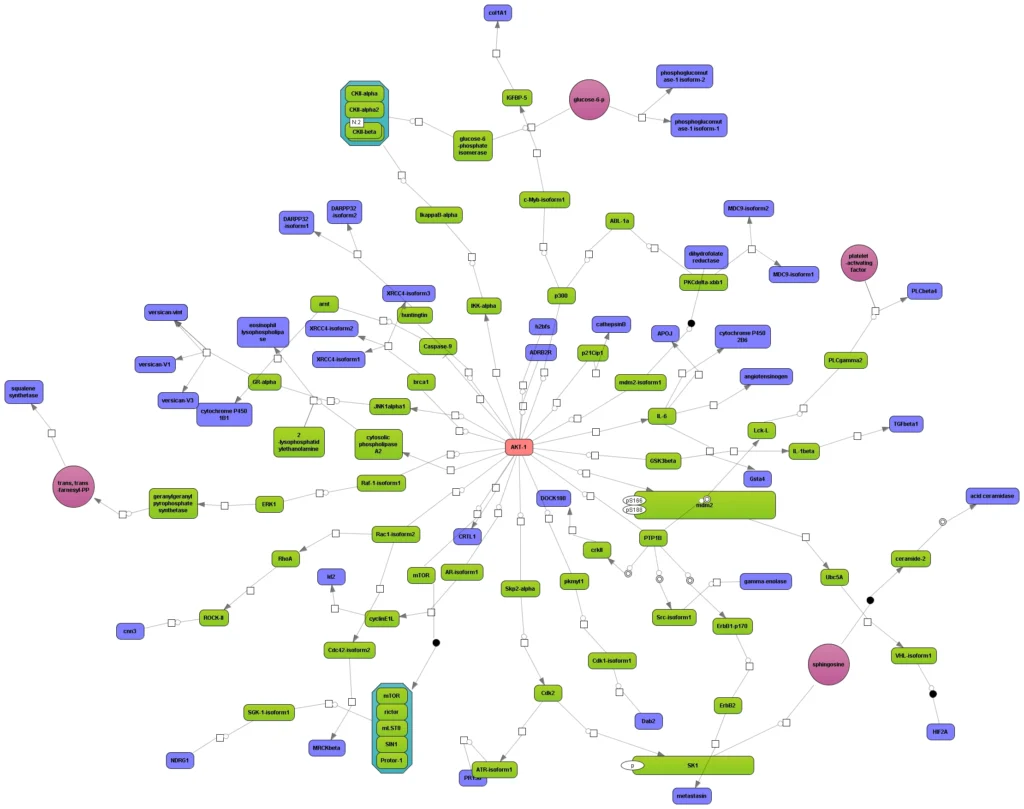
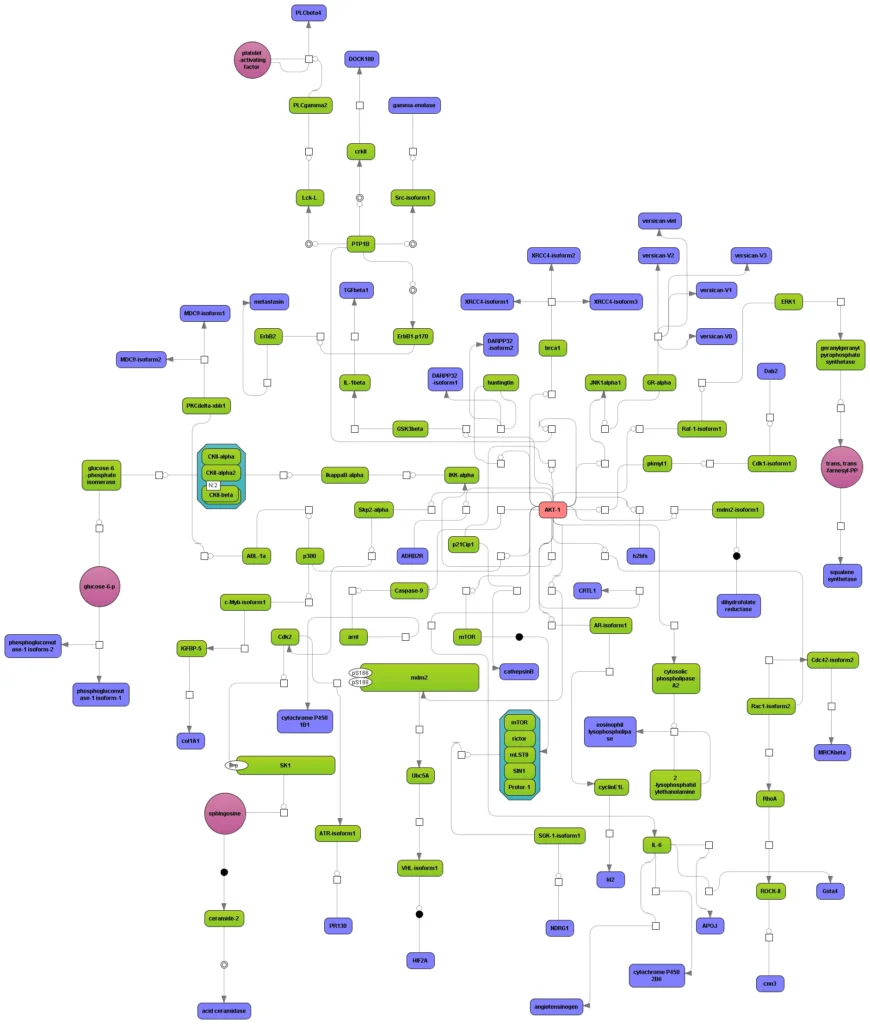
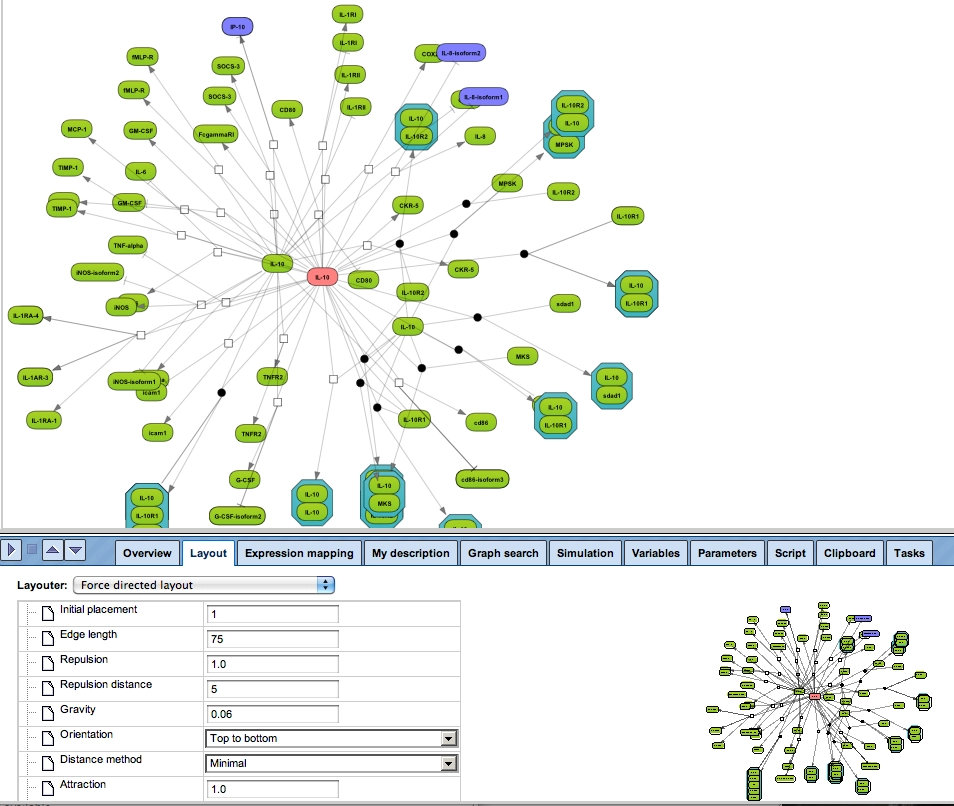
Proper handling of the layout is a particular challenge when displaying networks. The implementation in the geneXplain platform ensures an easy and fast reorganization of the layout between a hierarchical, force-directed and orthogonal layout scheme.

Graph search
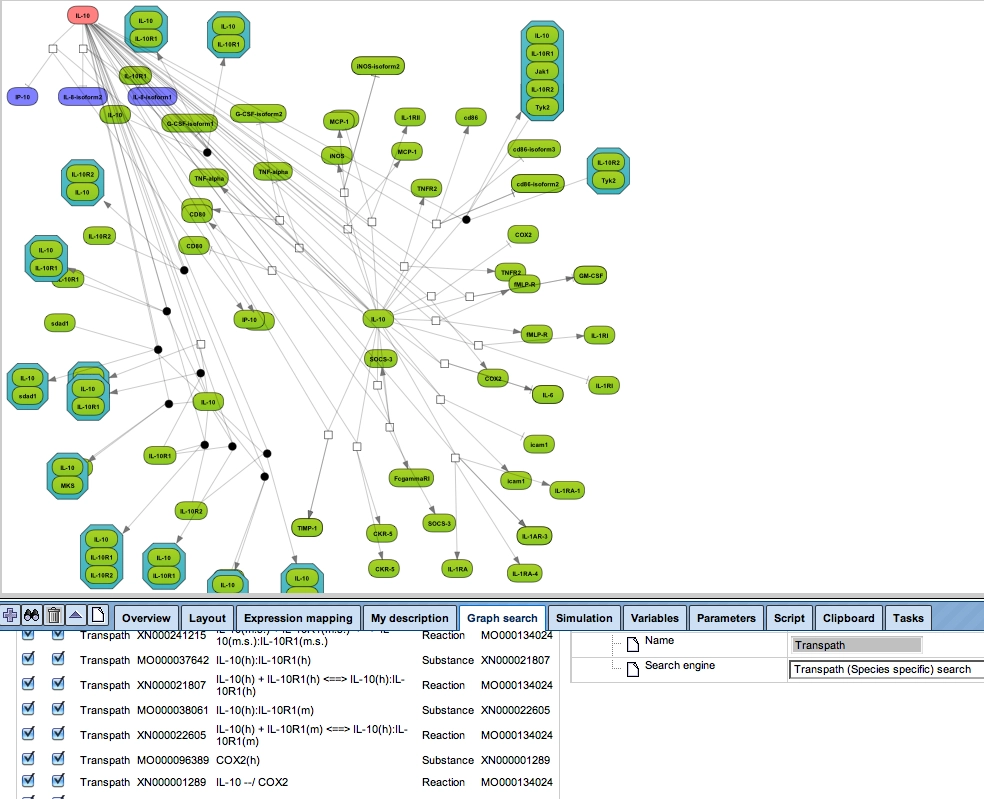
Any diagram constructed from TRANSPATH or GeneWays contents can be manually expanded to molecules that are connected to a selected node (see figure below). Subsequent automatic redesign will refine the appearance of the graph according to the chosen layout style.
Joining graphs
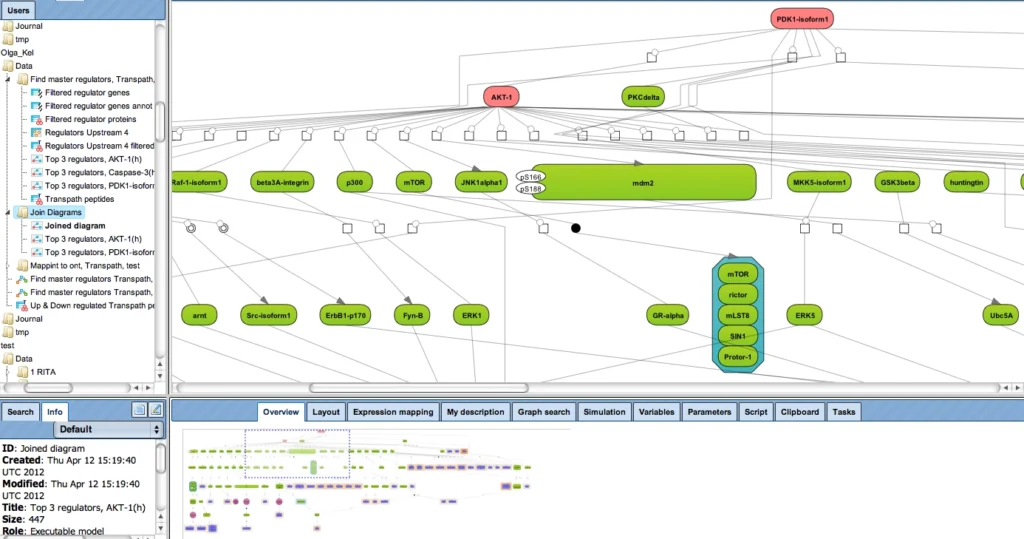
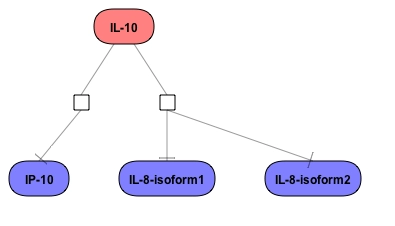
Several diagrams, e.g. pointing at different master regulators (figure below, red nodes), can be easily joined.
