geneXplain platform Introduction, Load data, Analyze any sequence for TFBSs (GTRD)
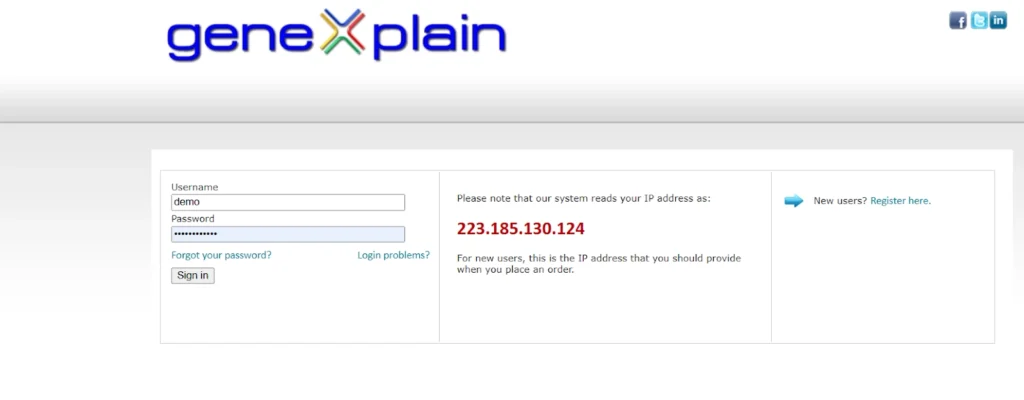
Welcome to the geneXplain platform. Login to the geneXplain platform using the credentials you used to create your account.
https://genexplain.com/log-in/
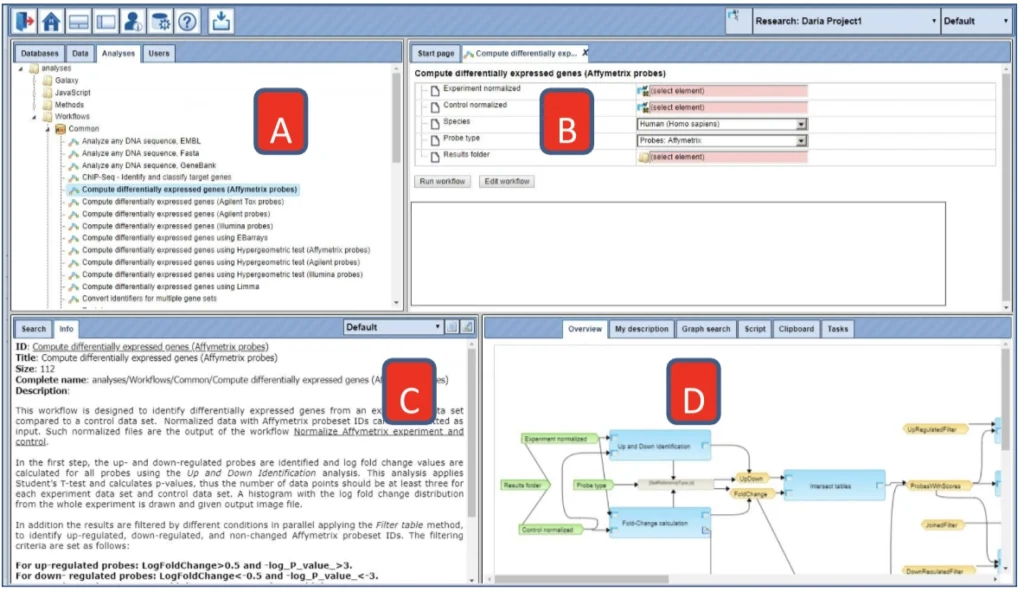
When you login into the geneXplain platform for the first time, a window opens that contains the following areas A-E:
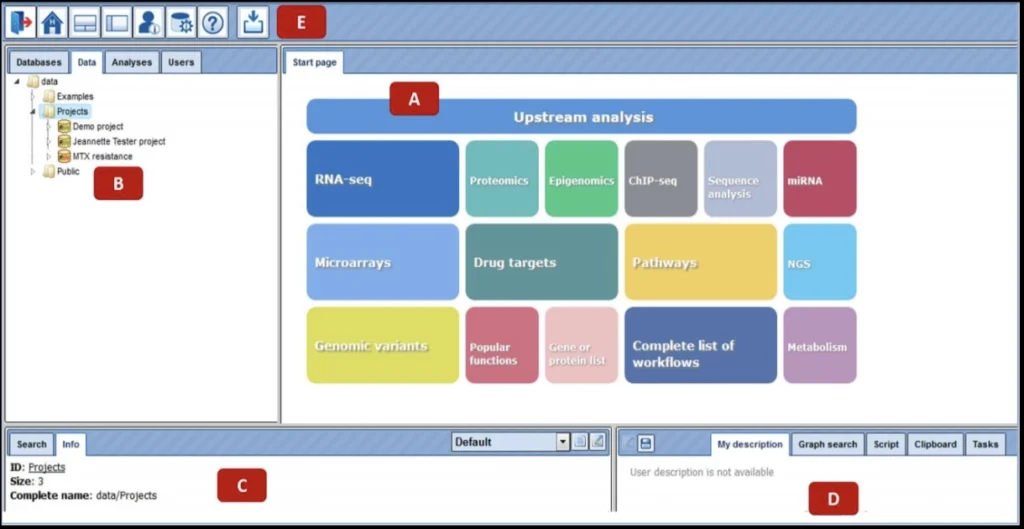
A – The Work Space is the main part of the window. The Start page presents the main predefined workflows and methods.
B– In the Tree Area you find the collection of Databases, the uploaded data files and the available analyses methods under the corresponding tabs.
C – The Info Box will give you information about the data file or analysis method that you select with a single click in the Tree Area. You can also select the data resource to search in.
D – The Operations Field provides additional analysis options under the different tabs in a context-dependent manner.
E – The general Control Panel (tool bar), on top of the different areas, shows a context-dependent set of icons for the available operations.
How to work on the geneXplain platform ?
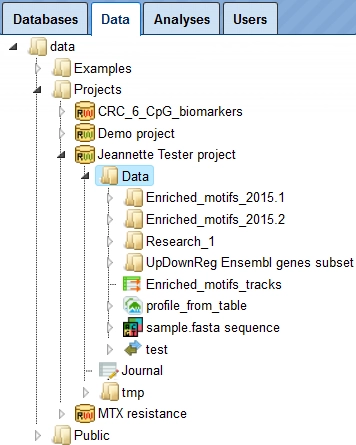
When you enter your account for the first time, you can see the following three folders in the Tree Area (B) under the Data tab (red box): Examples, Projects and Public.
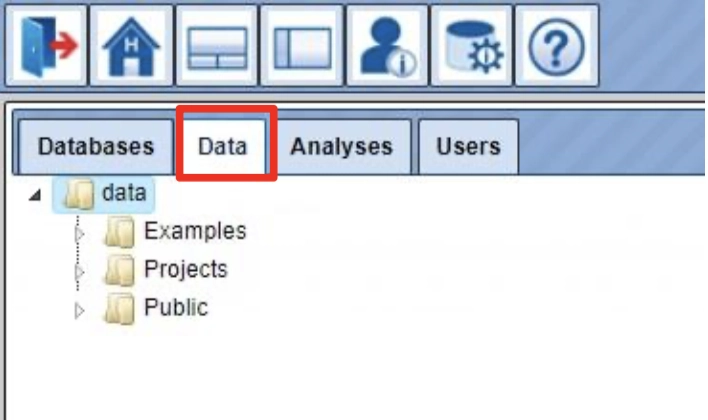
Each of these folders can be expanded (opened) by clicking on the small
triangle on the left side of the folder name and symbol.
You can find your created project (red box; your project name from the registration) after opening the folder Projects.
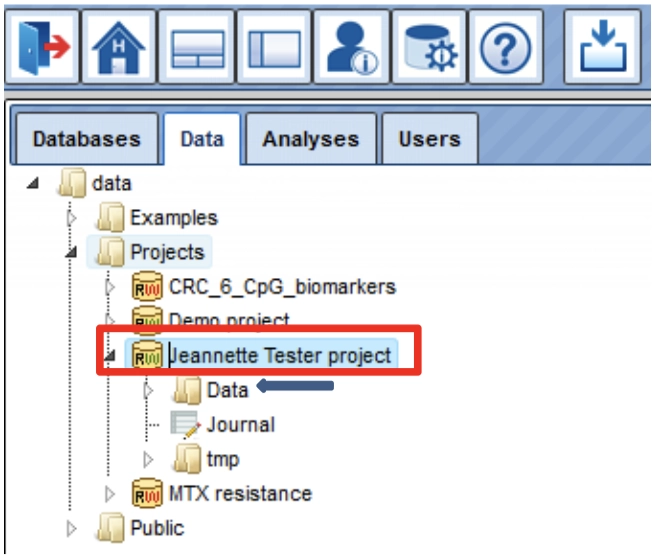
Your project contains the subfolder Data (blue arrow), where all your
uploaded data files and analyses results reside.
How to upload your data: Please see example below after the general introduction
How to open/delete a file in geneXplain platform
All analysis tools, and likewise all prepared workflows, require input data from a file in the Tree Area.
Double-clicking on a file will open it under a new tab in the Work Space.
Files can also be opened by right-clicking on them and selecting the “Open
table/track” option.
You can also delete files (“Remove”; default value is “No”) this way.
The content of the table is sorted according to the values in one of its columns. Being opened for the first time, a default column is defined for sorting, usually the ID column. This default column is indicated by a blue arrowhead (red box).
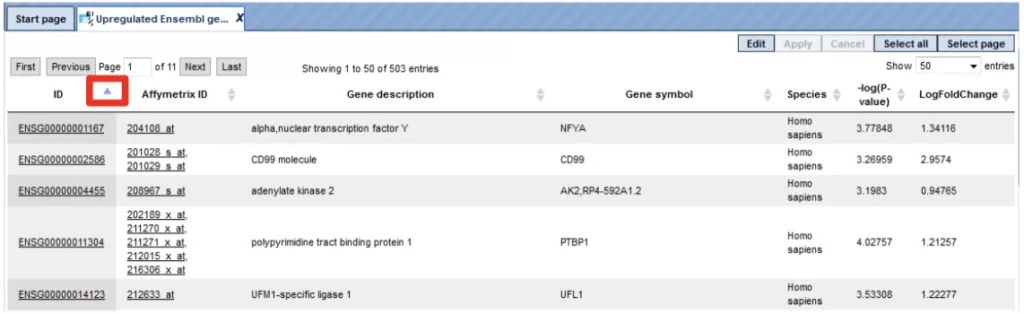
You may sort the table according to the values of any column in ascending or descending order by clicking on the up- or downwards pointing arrowhead on top of this column, respectively.
On top of the table, you can navigate between the individual pages of the table; it is also shown on which page of the table you are, and in the right top corner, the page size in terms of number of entries (rows) is shown and can be adjusted.
Which Analyses are supported
In the Tree Area under the tab Analyses, you find all Methods (red box) you may apply using the geneXplain platform.
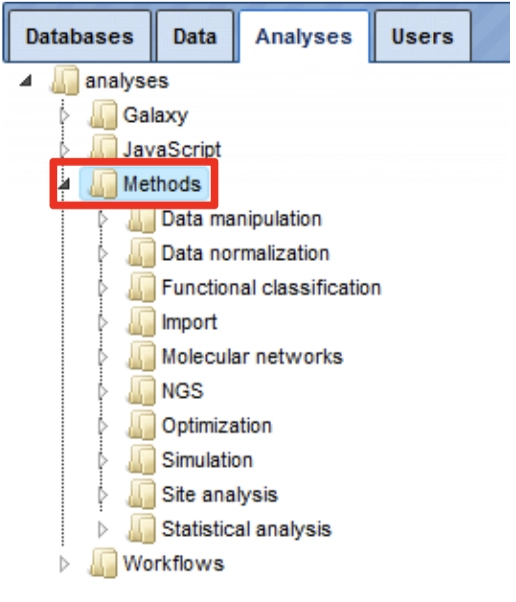
Upon double-clicking on a method name in the Tree Area the input mask for this method will be opened in the work space.
The input form of one method looks like this:
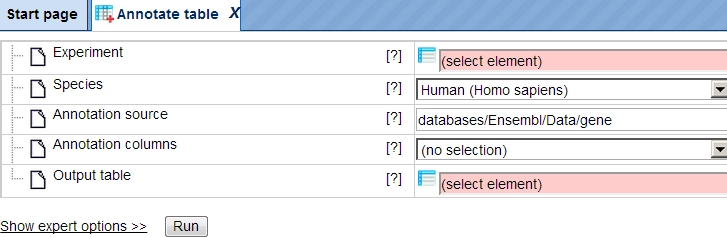
For starting a method just drag and drop you input file, verify your
settings and press the Run button.
As a result of this analysis, a new table will be created and automatically stored in your data folder.
What is a workflow ?
Workflows on the geneXplain platform are linked chains of methods to perform a bioinformatic analysis with one click.
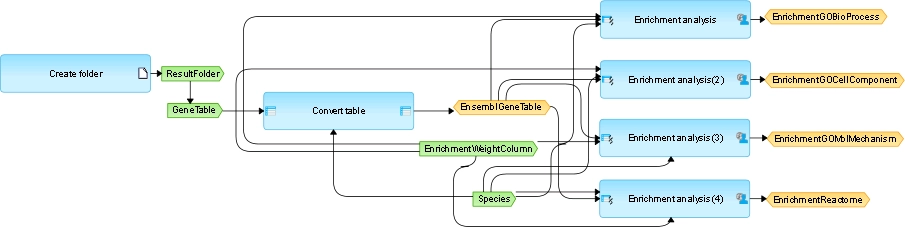
The picture shows a small workflow for the gene set enrichment analysis (GSEA) using four different ontologies: Gene Ontology (GO) Biological Process, GO Cellular Compartment, GO Molecular Function, and Reactome’s functional assignments (see right side).
The larger light blue boxes are analysis functions (program modules, “Bricks”). Green boxes stand for input files, especially user-defined inputs. Yellow boxes represent automatic delivery or output files.
The platform provides workflows for different topics e.g.
- Analyze ChIP-seq/RNA-seq data
- Analyze Microarray data
- Proteomics/Epigenomics/Metabolomics
- Discover functional enrichment (Gene Ontology)
- Analyze networks
- Identification of regulatory regions
- Finding drug targets
- Analyze genomic variants/mutations
- Expression and binding sites of miRNAs
- Working with NGS data
If you have valid licenses for e.g. TRANSFAC®, TRANSPATH® or HumanPSDTM databases the number of applications is higher.
Where are the workflows in the platform ?
- In the Tree Area under the tab Analyses, you find all workflows you may apply using the geneXplain platform. Upon double-clicking on a workflow name in the Tree Area (A) the method will be opened in the work space (B). Additional information is shown in the Info box (C). A schematic overview of the workflow is presented in the operation field (D).
- The new platform Start page arranges workflows according to major areas of interest. Select one button with your favorite analysis topic. You can expand the list of available workflows by clicking. The workflows from the start page are marked as blue links.
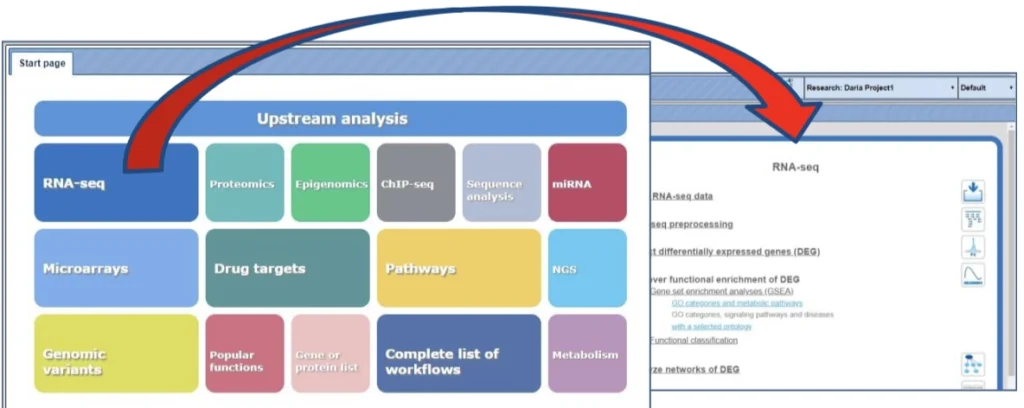
How to start a workflow ?
Open the workflow input form from the Tree Area or the Start page (see e.g. red box) by clicking.
For starting a workflow just drag and drop your input file(s), verify your settings and press the Run button.
geneXplain platform Examples
In the Tree Area under the tab Data, you find all stored output examples from different input data sets. Examples include data from different microarray platforms (Affymetrix, Agilent, Illumina), ChIP-seq-data, FASTQ, BAM and BED files, SNP data or sequence collections.
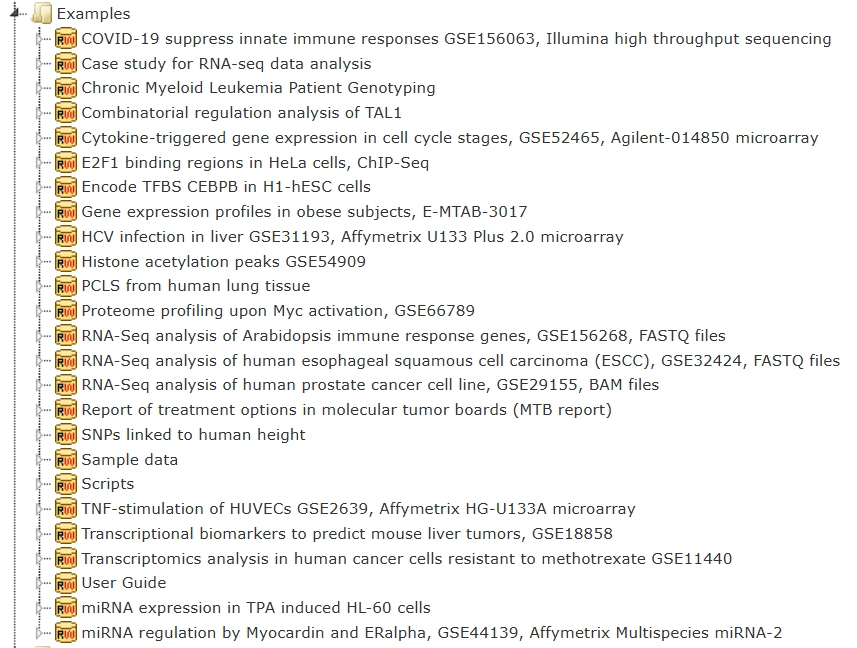
Each example comprises several analyses results, sorted in different
folders. You are welcome to open the output files and folders.
How to organize project and data in geneXplain platform
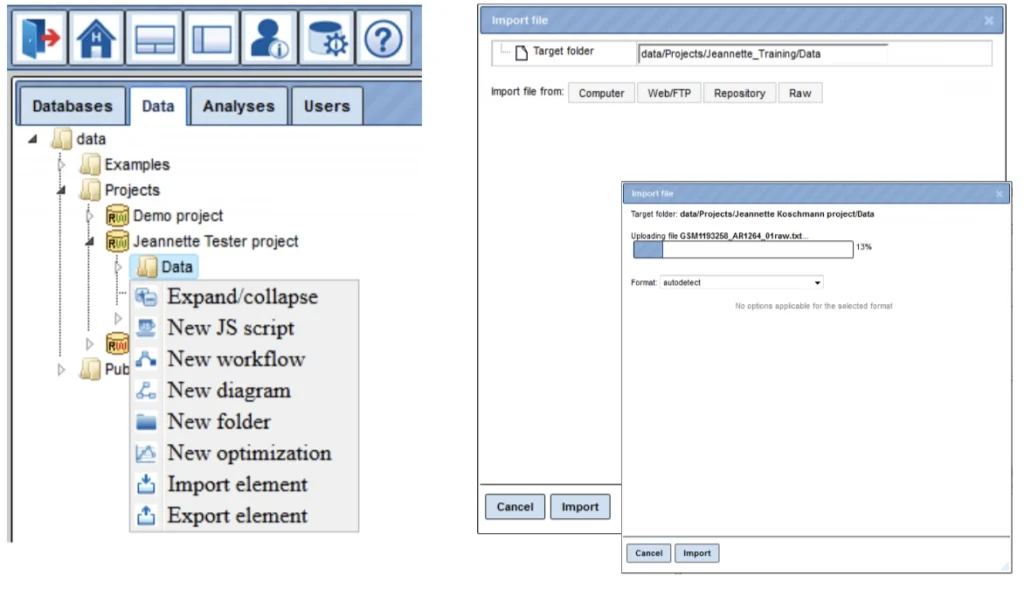
Upon right mouse click on the folder Data, as in the picture below, you can create a new folder within the selected one.
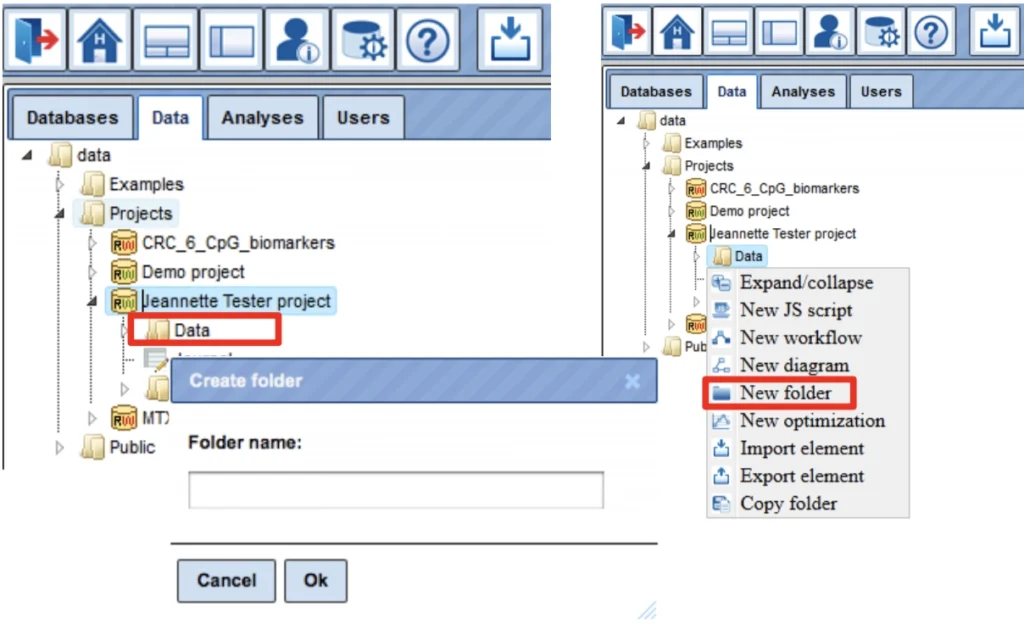
In this way, you can define the hierarchical organization of your folders and subfolders within your project, for example as shown below. Every time you run a workflow, you need to specify a location of the results folder, and you can specify any particular location within your project area.
Data Upload in geneXplain platform
There are three ways to import your data:
- Go to your Data folder (marked blue) and right click on it; select
“Import element” and a window „Import file“ will open:
Select one of the different upload options: Computer, WebFTP, Repository or Raw.
Press the „Import“ button to start loading data.
- Click the Import button of the tool bar
 , to open the window
“Import file“.
- Click on any button of the start page. The first list entry is always
“Load Data“ ![]() . Clicking on it will lead you to the window
. Clicking on it will lead you to the window
“Import file“.
- Once the import dialog box is opened, you can click on the desired option to input your data.
- You can import the file saved on your computer
- You can use FTP link to import
- Or you can paste the sequence directly for analysis.
- When you are uploading a fastq file, you are prompted to enter the genome build of the data, please select the correct option based on your data that you are importing.
In this folder you can find different types of data which are imported.
Example analysis:
Analyze any DNA sequence (GTRD)
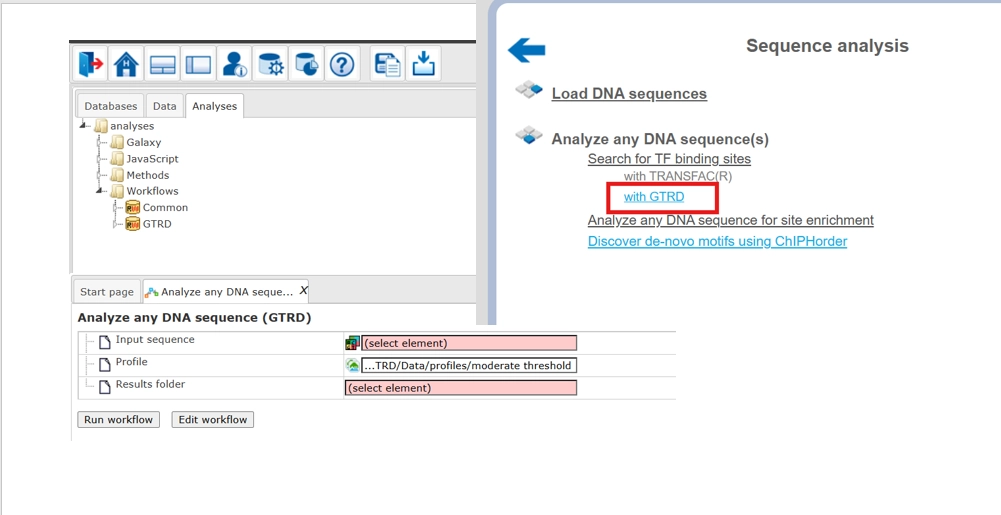
This workflow is designed to search for enriched transcription factor binding sites (TFBSs) in any input DNA sequence. With this workflow you can analyze sequences of any species and of any genomic region. To identify enriched binding sites within the input sequence, positional weight matrices from the GTRD database are used while performing the method Site search on track.
Within the workflow the input sequence is subjected to the ‘Site search on track’ method using the profile from the GTRD database called moderate threshold. The output sites are then subjected to the method ‘Site search summary’, which generates a summary on the site search result.
The steps to launch the workflow are as follows:
- Click here to open the workflow Analyze any DNA sequence GTRD
Alternatively you can click and open directly from the tree area under the GTRD folder.
- Specify an input file in the field Input sequence set. The input sequence set can be any sequence file having an EMBL, Genbank, or Fasta file extension. You can drag and drop the input file from your project to the workflow input form, Alternatively, you can use the input sample FASTA sequence from the public folder to run this workflow.
- After loading into the platform, the sequences in these formats are shown in the tree area with the icon (
 ).
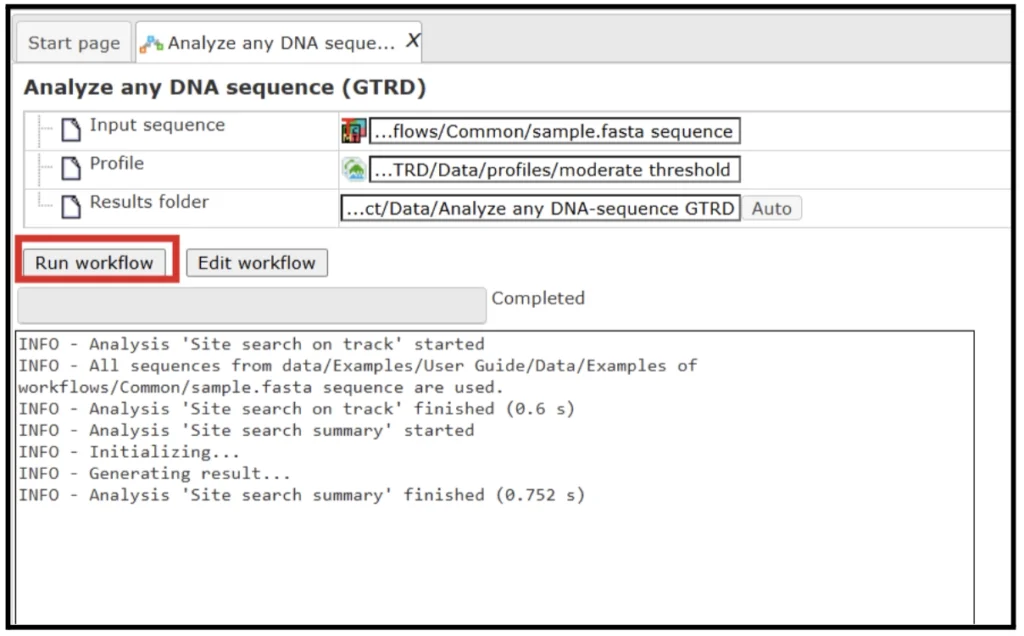
). - Select the default profile with ‘Moderate Threshold’. Specify the output path and output name and press ‘Run’
- The results folder consists of a summary table and a track with sites.
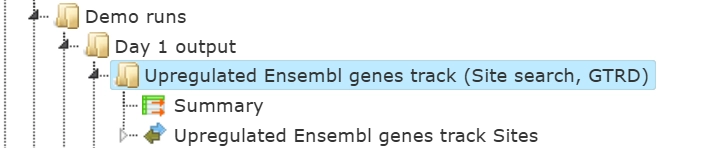
The track (![]() ) shows TFBSs that are found in the input sequences. Double click to open the file in the genome browser.
) shows TFBSs that are found in the input sequences. Double click to open the file in the genome browser.
Right click on this file and select the option ‘open as a table’.
Each row in the track file corresponds to one resulting TFBS and includes sequence names, site positions (the columns From and To), site Length and Strand, score calculated by the algorithm and a site model (here, GTRD matrix). This table can be exported using the export button on the top.
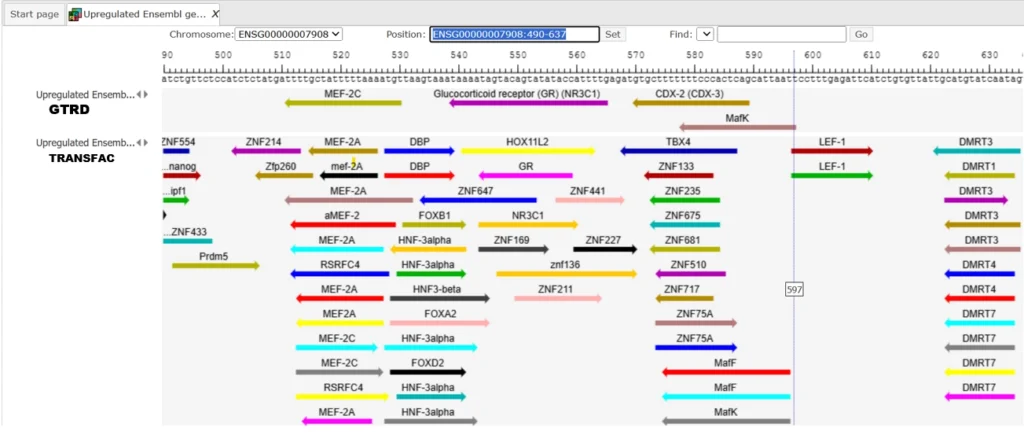
The table Summary gives the site density per thousand bp for each matrix in the input sequence. For each row, the column Site density per 1000bp shows the number of matches normalized per 1000 bp length for the sequences in the input set. TFBSs can be visualized in the genome browser.
The same workflow can also be run using the profiles of the TRANSFAC database with a much larger number of TF binding motifs (needs license).
You can check the results of the same workflow with the same input using the profiles from the TRANSFAC database here.
We will instruct about different methods within the platform in our next email.
Feel free to write to us at [email protected] in case of any issues.