Upstream Analysis: Identifying Master Switches in Gene Regulation
Introduction:
In complex diseases such as cancer and neurodegenerative disorders, cells often undergo extensive changes in gene expression. These alterations are typically controlled by a small set of critical “master switches” — most commonly transcription factors or key signaling proteins — that regulate entire gene expression programs.
Identifying these master regulatory molecules is of paramount importance, as they are the underlying drivers of the observed expression patterns and serve as compelling candidates for therapeutic intervention.
Upstream analysis offers a specialized approach to bioinformatics aimed at uncovering these master regulators by tracing the changes in gene expression back to their regulatory origins. By doing so, upstream analysis provides valuable insights into the molecular mechanisms driving disease and highlights potential targets for treatment.
What is Upstream Analysis?
Upstream analysis is a causal discovery method in transcriptomics. It was pioneered by geneXplain as an integrated promoter–pathway analysis aimed at finding the upstream regulators (“master regulators”) of observed gene expression changes.
Given a list of differentially expressed genes (DEGs) from an RNA-seq or microarray experiment, upstream analysis first identifies candidate transcription factors that could drive the observed changes in gene expression, followed by tracing the signaling pathways that activate those transcription factors.
This approach yields a short list of master regulatory molecules which could be transcription factors, kinases, receptors, or other signaling nodes that are most likely responsible for the gene expression program under study.
Notably, this is in contrast to traditional enrichment analyses (e.g. GO term or pathway enrichment) which identifies the consequences or downstream effects of the gene expression changes, while upstream analysis instead provides a hypothesis for the cause of those changes.

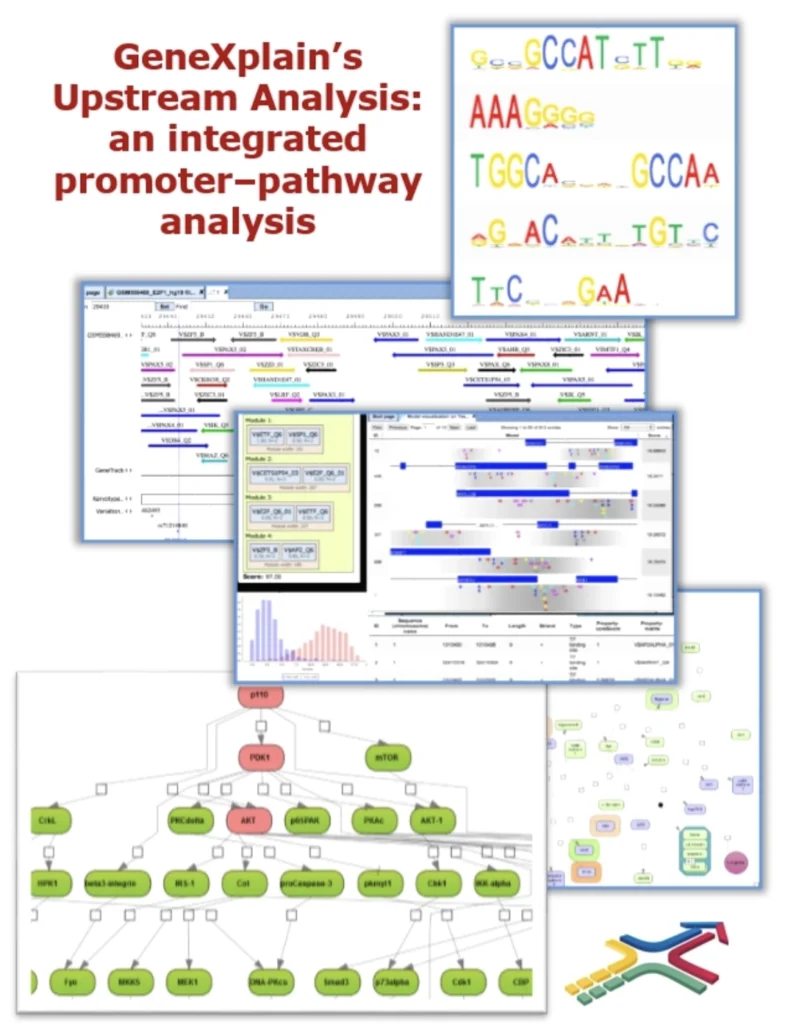
Figure 1: Concept of Upstream Analysis. This integrated approach combines promoter analysis (top: detecting enriched DNA motifs in gene promoters) with pathway analysis (bottom: mapping transcription factors to upstream signaling networks) to identify master regulators (red nodes at the top of the network) that control gene expression changes.
How Does Upstream Analysis Work?
The upstream analysis workflow proceeds in two main steps:
1. Promoter Motif Enrichment:
The first step scans the promoters of the DEGs for over-represented transcription factor binding motifs.
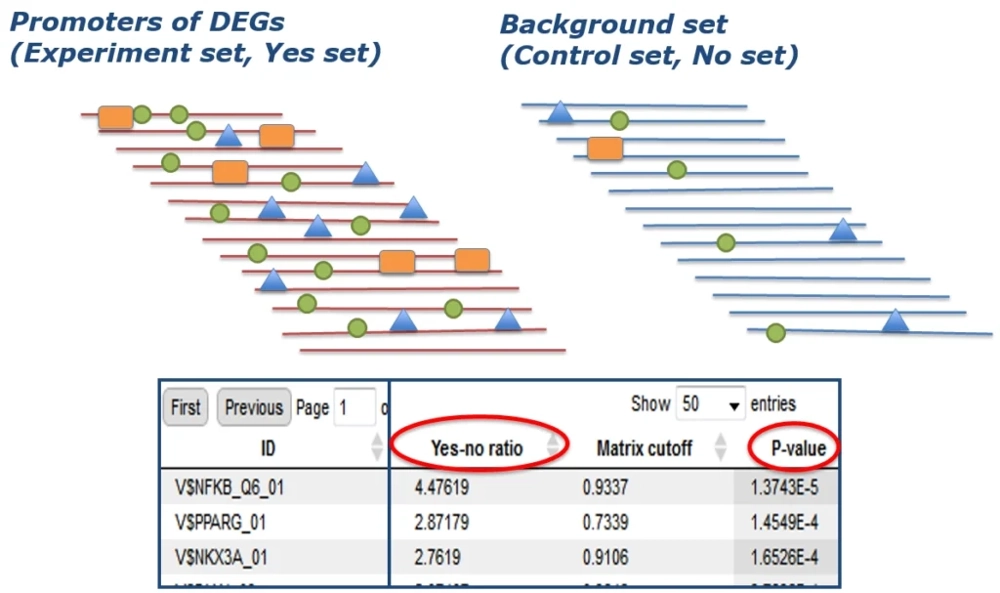
In practice, one takes the “Yes-set” (e.g. promoters of up- regulated genes in the disease or condition) and a “No-set” (promoters of non-regulated or background genes) and searches both sets for known DNA motifs using a library of position-specific scoring matrices (such as the TRANSFAC® database).
Using tools like the MATCH™ algorithm, all potential binding sites are identified in each promoter sequence. Statistical enrichment analysis is then applied to find which motifs occur significantly more in the DEG promoters than in background. The output of this step is a set of candidate transcription factors (TFs) whose binding sites are enriched in the target gene set, implying those TFs may have regulated the observed changes.
The result is summarized in a table of motifs/TFs with a high Yes/No ratio (indicating enrichment) and associated significant p-values.
For example, if genes involved in an inflammatory response are up-regulated, one might find NF-κB motifs highly over-represented in their promoters, pointing to NF-κB as a regulator.

Enriched motifs are those with a high occurrence in Yes vs No promoters (high Yes–No ratio, circled) and statistically significant p-value . Each enriched motif (row in table) corresponds to one or more transcription factors. This reveals which TFs are likely regulating the DEG set.
2. Pathway & Network Analysis:
The second step takes the candidate TFs from step 1 and explores upstream signaling pathways that could activate those TFs using a curated signaling network from the TRANSPATH® database.
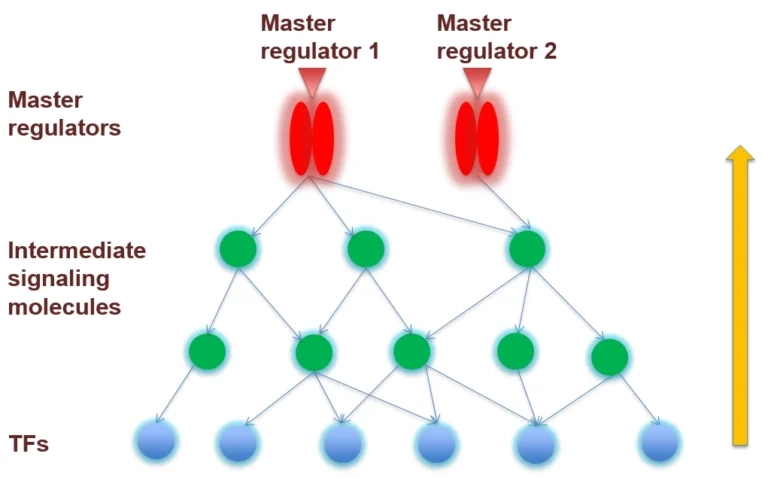
The analysis searches for molecules upstream of the identified TFs – such as kinases, receptors, or signaling complexes – that connect to many of these TFs. Often, multiple pathways will converge on a few common upstream nodes as the master regulators of the system.
In other words, the algorithm finds which regulatory molecules, if active, could plausibly explain the activation of the set of TFs (and thereby the observed gene expression profile). These master-level regulators might include key protein kinases (e.g. MAPKs, PI3K/mTOR), cell surface receptors (e.g. cytokine or growth factor receptors), or even higher-level transcription factors positioned at focal points of regulatory networks.
The result is a short list of top-ranked master regulator candidates accompanied by a network diagram showing how they connect down through intermediate signaling molecules to the transcription factors and target genes.

By combining these two steps, upstream analysis creates a cohesive picture: it starts from the gene list and ends with a hypothesis about which regulator at the top of the
hierarchy is driving those gene expression changes.
This integrated promoter-to-pathway approach is unique in that it leverages both genomic sequence data and interaction networks. Tools like the geneXplain platform implement this as an automated workflow – the platform first performs the site enrichment analysis on the input gene set and then runs a regulator search in the network to identify master regulators.
Notably, sometimes the analysis finds that some of the transcription factors from step 1 themselves are up-regulated, indicating a feed-forward loop where a TF both is activated and drives further changes.
The algorithm can account for such positive feedback loops in the network.
Case Study: Upstream Analysis in Triple-Negative Breast Cancer
To illustrate how upstream analysis works in practice, let’s consider a real example in cancer biology. Triple-negative breast cancer (TNBC) is an aggressive subtype of breast cancer defined by the absence of estrogen receptor, progesterone receptor, and HER2 expression. Because it lacks these usual drug targets, understanding what drives TNBC’s gene expression and growth is an area of intense research. Here, we use an RNA-seq dataset (NCBI GEO GSE188914) comparing a TNBC cell line (MDA-MB-231) to an ER-positive breast cancer cell line (MCF-7). The goal is to find the master regulators that make triple-negative cells behave differently from the ER-positive cells
Data and Setup:
The publicly available dataset provides gene expression profiles for MDA-MB-231 vs MCF-7 cells (three replicates each).
Using the geneXplain platform (including TRANSFAC® and TRANSPATH® databases), we identified the differentially expressed genes between the two cell types. In total, 437 genes were significantly up-regulated in the TNBC cells compared to the ER+ cells. These up-regulated genes include many known cancer-related genes and biomarkers of aggressive breast tumors.
For the promoter analysis, these 437 gene promoters were used as the “Yes-set”, while a set of ~500 non-changing genes from the same experiment served as the “No-set” background.
The analysis scanned promoter sequences (−1000 to +100 bp around transcription start sites) for TF binding motifs and identified which motifs were over-represented in the TNBC-upregulated genes.
Promoter Analysis Results:
The algorithm found 68 DNA motifs significantly enriched in the promoters of genes upregulated in TNBC vs ER+. These motifs correspond to 132 transcription factors (since some TFs share similar binding patterns).
Many of these candidate TFs are intriguing: notably, 46 of the identified TFs were themselves up-regulated in the TNBC cells (i.e. they appear in the list of 437 genes). This suggests a self-reinforcing network – the TNBC cells have turned on certain transcription factors, which in turn regulate other genes in the up-regulated set (and possibly sustain each other’s expression).
For example, one enriched motif was for IRF1 (Interferon Regulatory Factor 1). The IRF1 gene was highly up-regulated in MDA-MB-231 vs MCF-7 (log₂ fold change ≈ +3.0) and its binding site motif was over-represented ~2.2-fold in the promoters of TNBC-up genes.
This means IRF1 is not only more expressed in TNBC cells, but it likely directly drives many of the TNBC-specific genes. Indeed, the analysis identified 54 putative IRF1 target genes within the up-regulated gene list. Other enriched motifs pointed to factors like E2F family members (cell cycle regulators), AP-1 complex proteins, NF-κB, and the glucocorticoid receptor (GR), all of which have known roles in cancer, cell proliferation or stress responses.
This rich set of candidate regulators provides a preliminary “suspect list” which may account for the differences between the TNBC and the luminal breast cancer cells at the transcriptional control level.
Pathway Analysis Results:
In the second step, the list of candidate TFs was fed into the upstream network analysis to search for common upstream regulators. The geneXplain platform’s Regulator Search traversed the signaling network (Human signaling pathways from TRANSPATH and other sources) to find molecules that can influence these TFs.
The result was a set of 12 master regulator candidates that -are at the convergence of pathways leading to the identified TFs. Interestingly, many of these master-level molecules were also up-regulated in the TNBC cells, underscoring their potential importance in this context.
Top hits are summarized below:
Overall, these findings draw a coherent picture of the TNBC cell line’s regulatory landscape.
Upstream analysis suggests that TNBC’s aggressive phenotype is driven by a combination of inflammatory signaling (TNF-family receptor CD40 and NF-κB), stress hormone signaling (GR), and cell cycle dysregulation (E2F, Myc, Nek2 kinase). These master switches coordinately activate downstream transcription factors and gene programs that collectively differentiate triple-negative cells from their less aggressive, receptor-positive counterparts.
Importantly, many of the identified master regulators are known drug targets or biomarkers. For instance, if CD40 is truly a critical upstream driver, it might be exploitable via immune-modulating therapies; if Nek2 or Myc are key, cell cycle inhibitors could be considered.
The upstream analysis thus generates concrete hypotheses for experimental validation.
It’s worth noting that upstream analysis doesn’t prove causation by itself – but it greatly narrows the field. Researchers can take the shortlist of predicted master regulators and design follow-up experiments (such as inhibition or knockdown studies) to test their impact.
In our TNBC example, one could treat MDA-MB-231 cells with a CD40-blocking antibody, a glucocorticoid inhibitor, or a Myc inhibitor to see if the TNBC-specific gene signature (or cell behavior) is reversed.
Conclusion and Outlook
GeneXplain platform’s Upstream analysis is a powerful strategy for making sense of “omics” data in a mechanistic way.
By integrating promoter motif searches with signaling pathway knowledge, it allows scientists to move from a descriptive list of gene expression changes to a testable model of why those changes occurred. In diseases with complex regulatory changes, such as cancer, autoimmune disorders, or neurological diseases, this approach helps highlight the key regulators (master transcription factors, kinases, receptors, etc.) that could become diagnostic markers or drug targets.
The TNBC case study we explored showcases how upstream analysis can reveal insightful leads (like CD40 and E2F factors) that conventional analyses might miss. Armed with these insights, researchers can design focused experiments or interventions to validate the roles of these master switches.
Ultimately, upstream analysis exemplifies the kind of systems biology approach that is increasingly necessary: it helps connect the dots from genomic data to actionable biological understanding, by shedding light on the regulatory control of individual gene changes.
Get free reports and case studies to your Email
