Lesson 3. RNA-seq data analysis
The geneXplain platform provides a comprehensive suite of workflows and methods for processing RNA-seq data. To browse the full list, navigate to the Start page and select the RNA-seq tile.
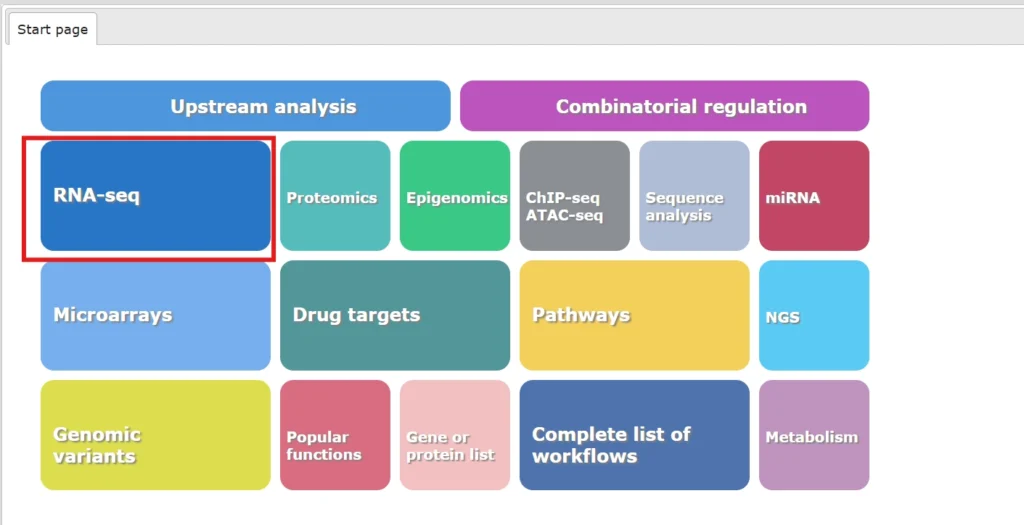
For demonstration, we have saved sample fastq files in the public folder. You can access them from here.
Read this document for step by step instructions on upload of fastq files from GEO.
Pre-process RNA-seq data
Starting RNA-seq data analysis for identification of differentially expressed genes, the data need to be pre-processed as shown in the following schema/workflow.
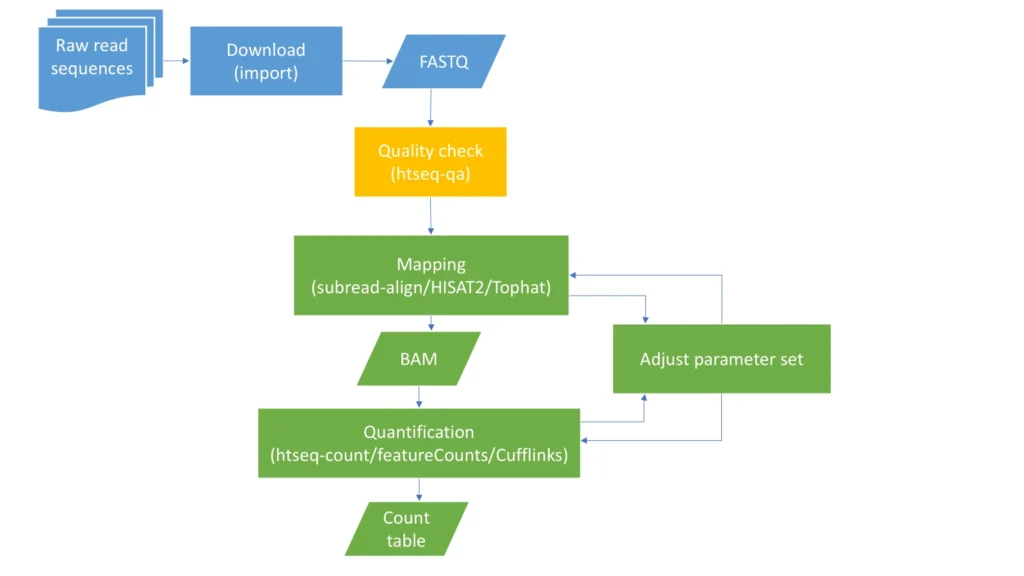
Refer to the video series mentioned below for detailed guidance on preprocessing RNA-Seq data:
RNA-seq preprocessing in geneXplain platform: quality control
RNA-seq preprocessing in geneXplain platform: read alignment
RNA-seq preprocessing in geneXplain platform: read quantification
These videos demonstrate the functionality of the methods:
Htseq-qa
Click here to access the video
Subread-align
Click here to access the video
Feature counts
Click here to access the video
Identify differentially expressed genes
To identify differentially expressed genes from FASTQ files, simply run the ready-made workflow, which integrates all required methods in a single click-and-run process. The workflows can be found under the start page RNA-seq tile
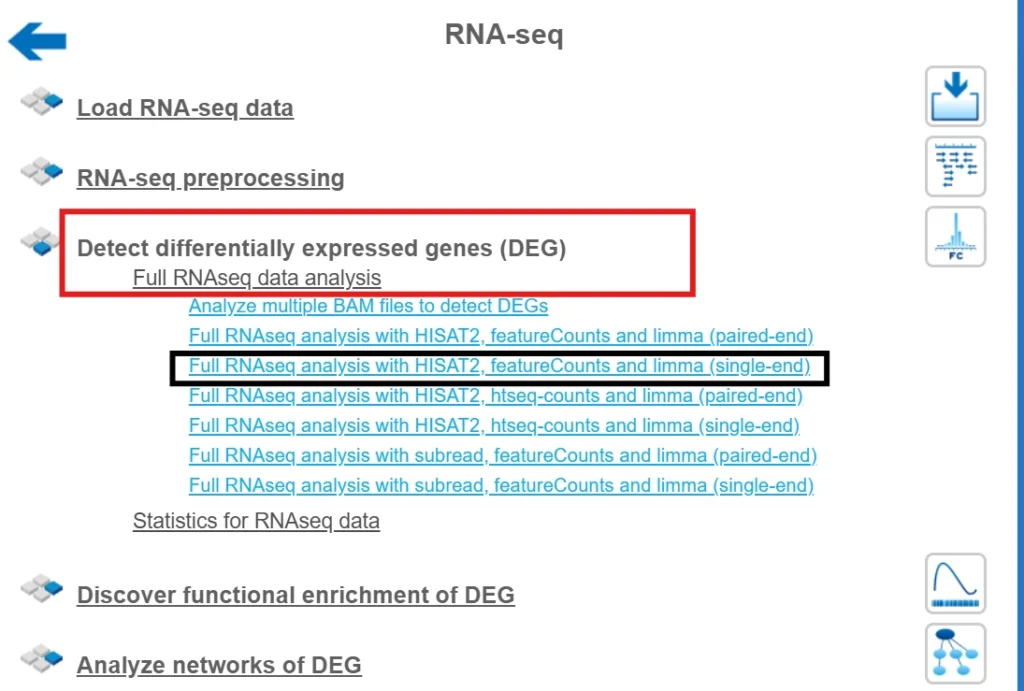
Here we demonstrate the workflow with HISAT2, Feature counts and Limma.
This workflow is designed to analyze a biological experiment with two conditions (for example patients with a disease vs. a control group without disease). The workflow aligns raw FASTQ files from a single-end library with a specified reference genome and outputs the aligned reads in BAM tracks, which can be visualized in the genome browser. A quality assessment report is given for each FASTQ file. The BAM tracks are further used to assign the sequence reads to genomic features, in this case genes. Finally, statistics are performed to determine differentially expressed genes between the two input conditions.
Sample fastq files are entered in the input form, keeping all other parameters as default, we press ‘Run’.
The output is saved in the output folder.

In the first part of the workflow the single-end Illumina FASTQ files are mapped to the selected genome using the Galaxy tool HISAT2. HISAT2 enables an extremely fast and sensitive alignment of reads. The minimum mapping quality is set default. to 0 counts per gene.
In the second part of the workflow the method featureCounts counting the aligned reads in BAM format to genomic features, in this case as genes.
For each FASTQ file alignment an output subfolder is generated and contains a track file with the alignment and the alignment summary.
The outputs of counting genes are saved in two tables: one file contains the read counts and the other a count summary of the counting procedure.
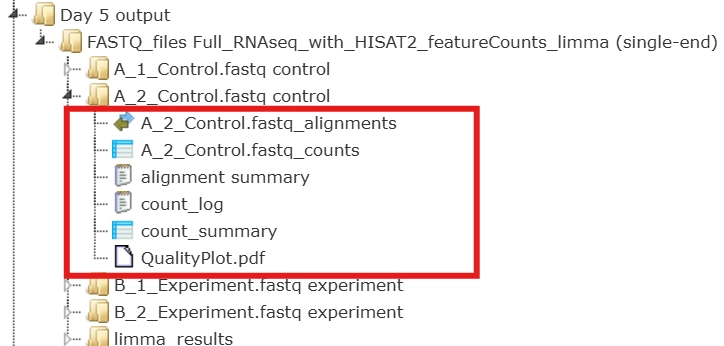
The last step of the workflow performs a differential expression analysis on raw counts with limma-voom. A result folder of the limma-voom analysis is generated and contains several tables.
After normalization the prepared table is used to determine DEGs as a final table with two filtered tables of up-regulated and down-regulated genes as well as non-regulated genes.
Following filter conditions are used:
Up-regulated genes: logFC > 0.5 && P-value < 0.05
Down-regulated genes: logFC < -0.5 && P-value < 0.05
Non-regulated genes: select middle percentage of DEGs (min 100 & max 1000)
All output results can be exported to your local computer.
The differentially expressed genes can be used to run other workflows.
Functional enrichment
You can perform functional enrichment of genes of interest using pre-defined workflows in geneXplain platform.
Click on Functional enrichment in the RNA-seq tab
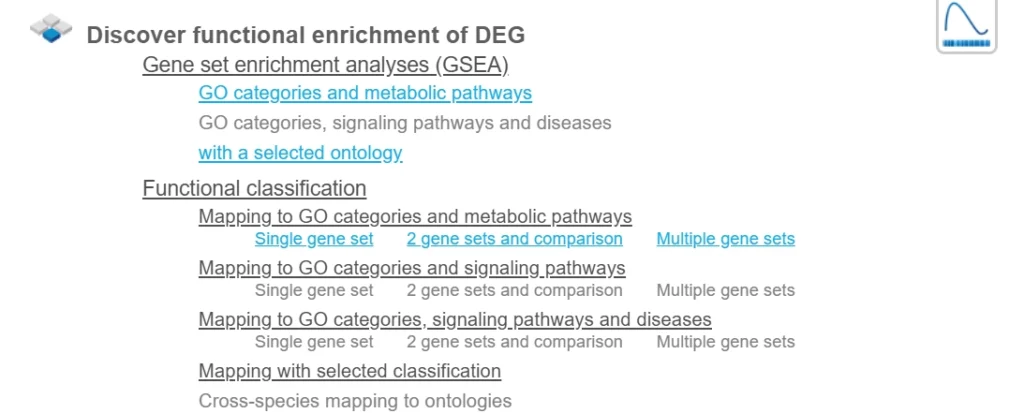
Workflows highlighted in blue are included with the free version of the geneXplain platform; greyed-out workflows require licensing.
For this walkthrough, we will perform GSEA and functional classification on the upregulated gene set from above.
GSEA
The Gene Set Enrichment Analysis (GSEA) is a method that determines whether an independently defined set of genes shows a statistically significant enrichment either in up-regulated or down-regulated genes.
This workflow performs the GSEA divided by the three branches of Gene Ontology, biological process, molecular function and cellular component, as well as by the Reactome pathways, for any input gene or protein table. It is important to note that such a table should have a column which can be used as a weight column for enrichment, e.g. expression value.
You can launch the workflow from the Start page or Workflows tab in the tree area. Simply drag the input into the form.
As soon as you specify the input table, the drop-down menu in the field Enrichment Weight Column becomes active. It presents all numerical columns in the input table. Select which column should be used for enrichment calculations.
Select the species, choose the output path and name, and hit Run
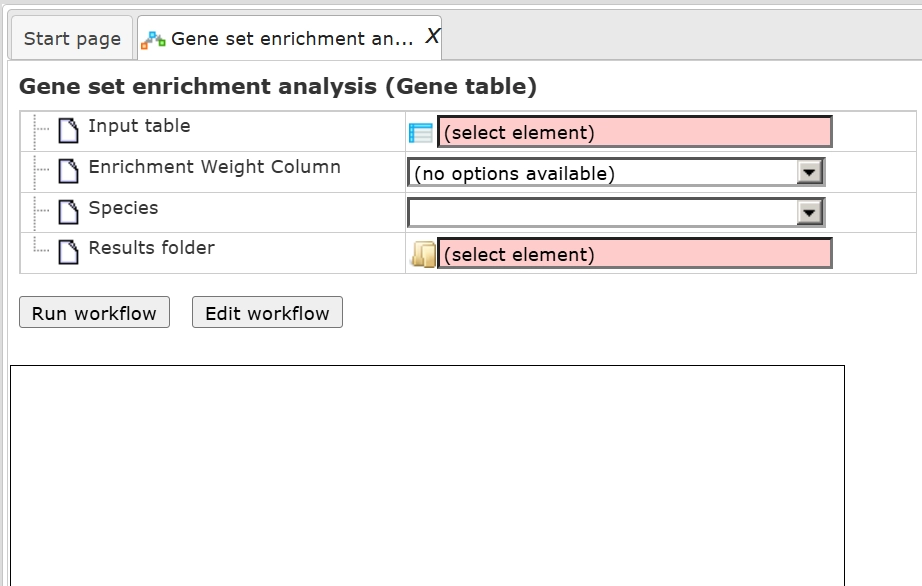
Input gene used for demonstration can be accessed using the link:
The output is a folder and output files open by default in the workspace.

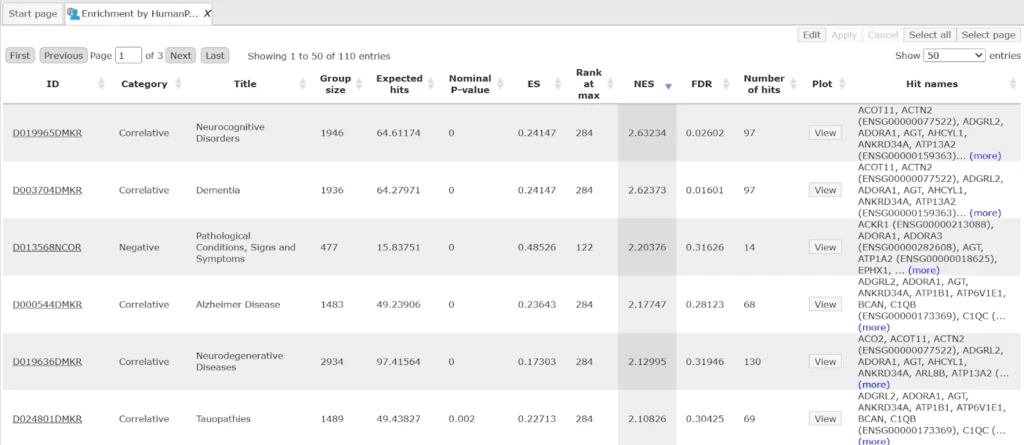
Several statistical parameters, ES (Enrichment Score), NES (Normalized Enrichment Score), Rank at max, nominal p-value, FDR, for each GO category are calculated. ES and NES reflect how significantly genes in each particular GO category are enriched (over-represented) among up-regulated genes.
Output table looks like this:
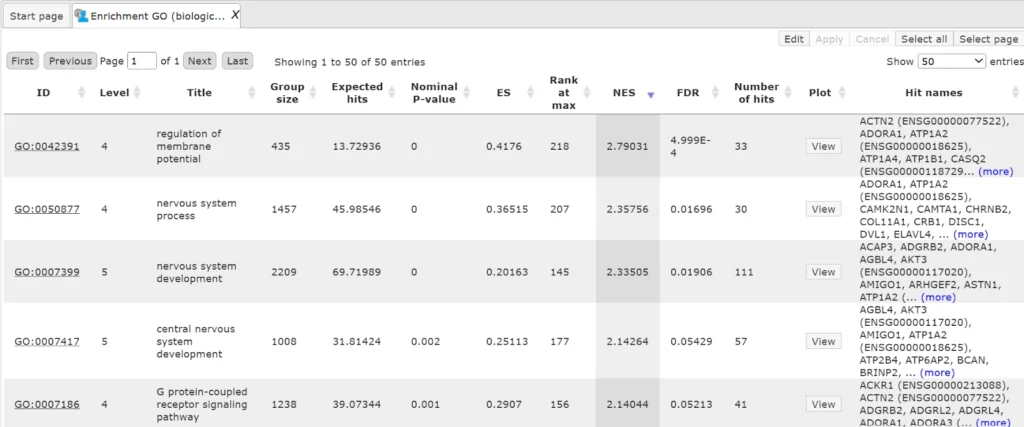
The column ID comprises the identifier of the ontological category, here identifiers of Gene Ontology biological process terms. These identifiers are hyperlinked to the page http://www.ebi.ac.uk/QuickGO/ where you can get further information about this ontological term.
The columns Title and Group size contain further details about the ontological terms, its title and the number of genes linked to this term in the corresponding database, here in GO. The column Expected hits shows the number of genes expected to fall into this category by random chance, based on the size of the input set and the size of the category. The column Number of hits shows how many genes from the input table fall into this category. P-value and Adjusted p-value are calculated for the difference between expected and real numbers of hits. The genes mapped to each category are explicitly listed in the column Hit names. As the lists can get quite long, only a few genes are shown by default in each row. To get the full list, press [more].
The same workflows when run with licensed databases TRANSPATH and HumanPSD gives links to additional mapping with TRANSPATH pathways and disease biomarkers from the HumanPSD database

The output folder with licensed databases can be found here.
Output table with Enrichment by TRANSPATH pathways is as shown below:
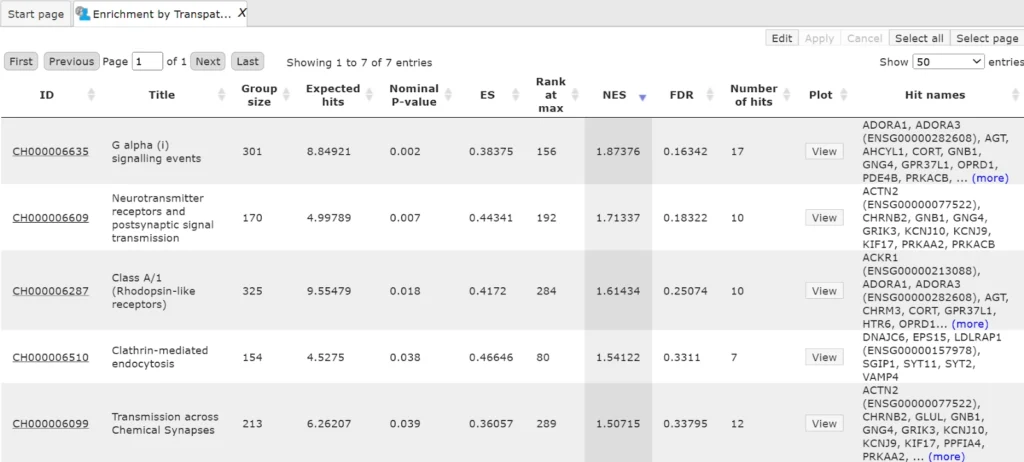
Output table with Enrichment by HumanPSD Disease is as shown below:
Mapping to Ontologies
This workflow is designed to perform a functional classification of an input gene or protein table with mapping to different ontologies: Gene Ontology biological processes, Gene Ontology cellular components, Gene Ontology molecular function, Transcription factor classification (TFclass), Reactome pathways, and HumanCyc pathways and identify GO terms or pathway hits, which are overrepresented in the input table. The key difference from GSEA is that the ontologies workflow does not incorporate weights.
Open the workflow from the RNA-seq tab on the start page or from the workflows/common folder in the Analyses tab.
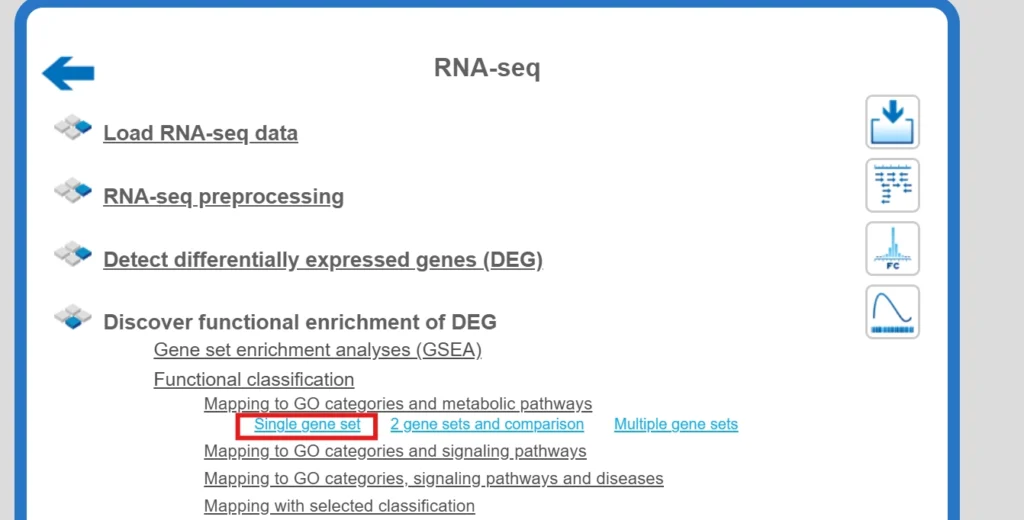
A gene or protein table can be submitted in the input field Input table.
You can drag and drop the input table from your data project within the tree area or you may click into the input field and a new window will be opened, where you can select your input table.
You need to select the biological species of your data in the field Species by choosing the required one from the drop-down menu.
The workflow converts the input gene or protein list into a list with Ensembl gene IDS and is mapped to the following functional classifications with the method Functional classification:
At least two genes or proteins must be mapped into one group (e.g. one GO term, one pathway) and a P-value threshold lower 0.05 is given for each group.
Each row in the functional classification resulting tables presents details about one ontological term. The column ID comprises the identifiers of the ontological term like GO:0009888 (tissue development) in the Gene Ontology category of biological process terms. These identifiers are hyperlinked to the page QuickGO), where you can get further information about this ontological term.
Input: For demonstration purposes we used the set of Upregulated genes from the sample fastq files.
Output: You can check the output generated using the workflow here.
With the licensed databases TRANSPATH and HumanPSD, the same workflow can map results to additional ontologies — including HumanPSD disease terms and TRANSPATH pathways. You can view the output of the Mapping to Ontologies workflow using these databases (with the same input) here.
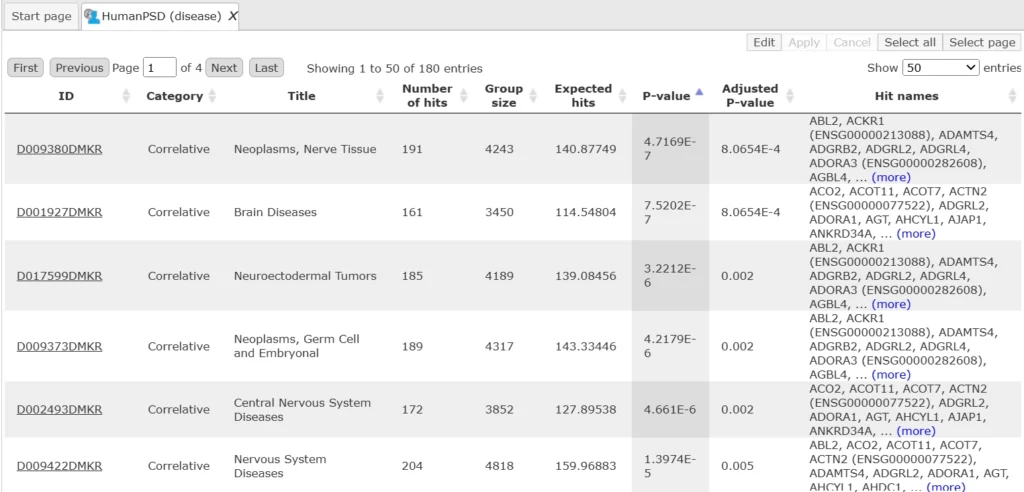
Snapshot of HumanPSD disease terms
Why a License Matters
A licensed TRANSFAC® package gives you:
- Complete and current datasets unavailable in free versions.
- Regular updates and professional support from the geneXplain team.
- Possible Integration with TRANSPATH® and HumanPSD™ for pathway, disease, and drug insights.
- Reproducible, publication-ready results trusted in academia, pharma, and translational research.
To summarize, licensing TRANSFAC® is not just an upgrade—it’s an investment in scientific accuracy, data integrity, and discovery speed.
It provides the depth, precision, and interpretability required to confidently move from sequence data to biological understanding and translational outcomes.
