Multi-omics integration
Multi-Omics Integration for Pathway Discovery: Insights from an Ovarian Cancer Case Study
What is Multi-Omics Integration and Why Does It Matter?
Multi-omics integration is combining multiple layers of “omics” data (genomics, transcriptomics, epigenomics, proteomics etc) to get a systems-level view of biology. Instead of analyzing one data type in isolation, multi-omics approaches merge these datasets to see how different molecular players interact. This is especially important in systems biology and disease research because complex diseases often involve network-wide dysregulations that span multiple molecular layers.
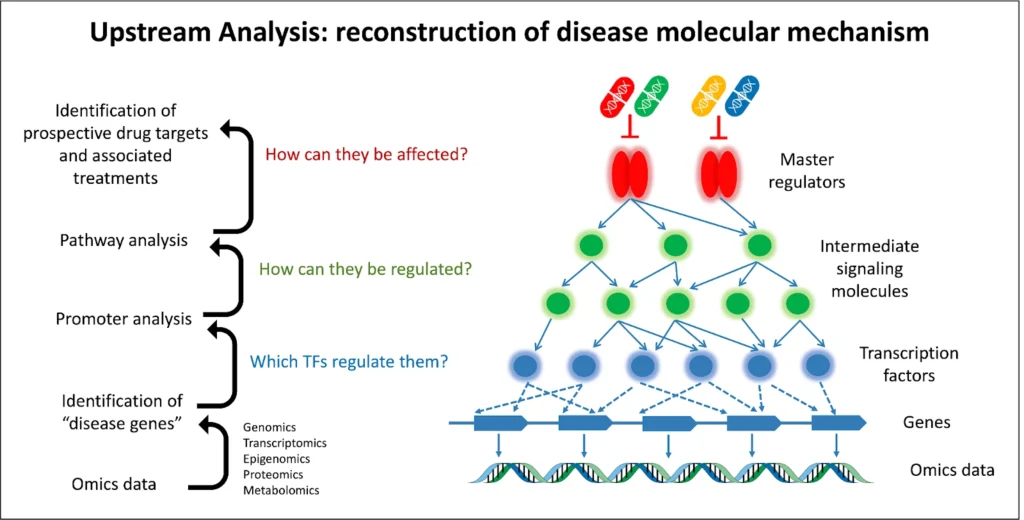
By integrating different data, researchers can move beyond correlations to causal insights – for example, identifying master regulator genes or proteins that when perturbed rewire downstream pathways and drive a disease phenotype.
In short, multi-omics integration helps to identify the key drivers (“molecular mechanisms”) of a condition that would be missed by a single-omics approach. In practical terms, a multi-omics strategy can show how changes at one level (say DNA methylation in the epigenome) can lead to changes in gene expression in the transcriptome which in turn affect protein signaling networks.
This holistic view is key for complex issues like drug resistance in cancer where changes in gene regulation, signaling pathways and even metabolism can all intertwine. By looking at multiple layers together, scientists can identify critical points in the system – for example a transcription factor or receptor that if targeted could modulate the activity of an entire network of disease related genes . This systems-level view is what makes multi-omics integration so powerful in modern biomedical research.
Integrated Click-and-Run Pipeline by geneXplain
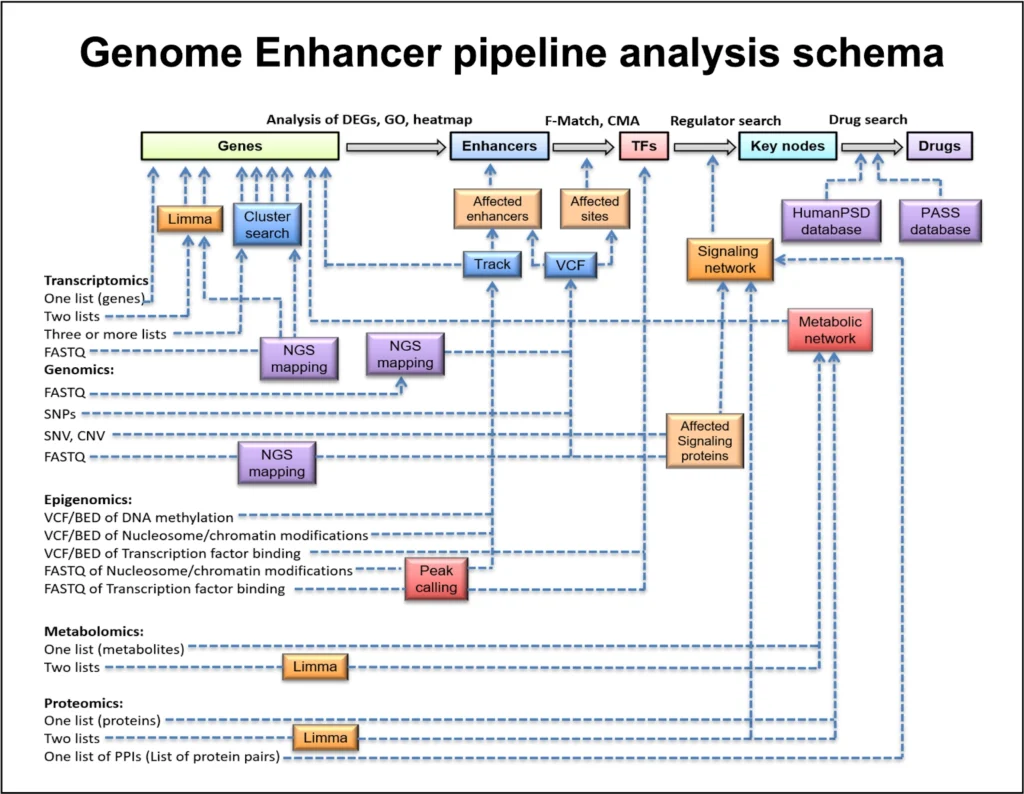
geneXplain’s Genome Enhancer provides a fully integrated, click-and-run solution that automates this entire workflow. From raw omics data input to pathway discovery and drug candidate prediction, the platform streamlines all six steps—ensuring reproducibility, ease of use, and scientific rigor.
Detailed description of the Genome Enhancer analysis
Once the Genome Enhancer analysis was launched, the pipeline will create a workflow in respect to the analysis input. The workflow architecture depends on the number of selected conditions, which should be analyzed. Conditions for comparison are specified by the user upon the data annotation step, e.g. they can be Experiment vs. Control:

The process of Multi-omics analysis in Genome Enhancer can be summarized below:
1. Preprocessing and Differential Analysis
Preprocessing involves converting raw omics data into structured, analyzable formats through steps like read mapping, quantification, and quality checks. Differential analysis then identifies genes or molecules that show significant changes between experimental conditions.
2. Integration of Transcriptomics and Epigenomics Data:
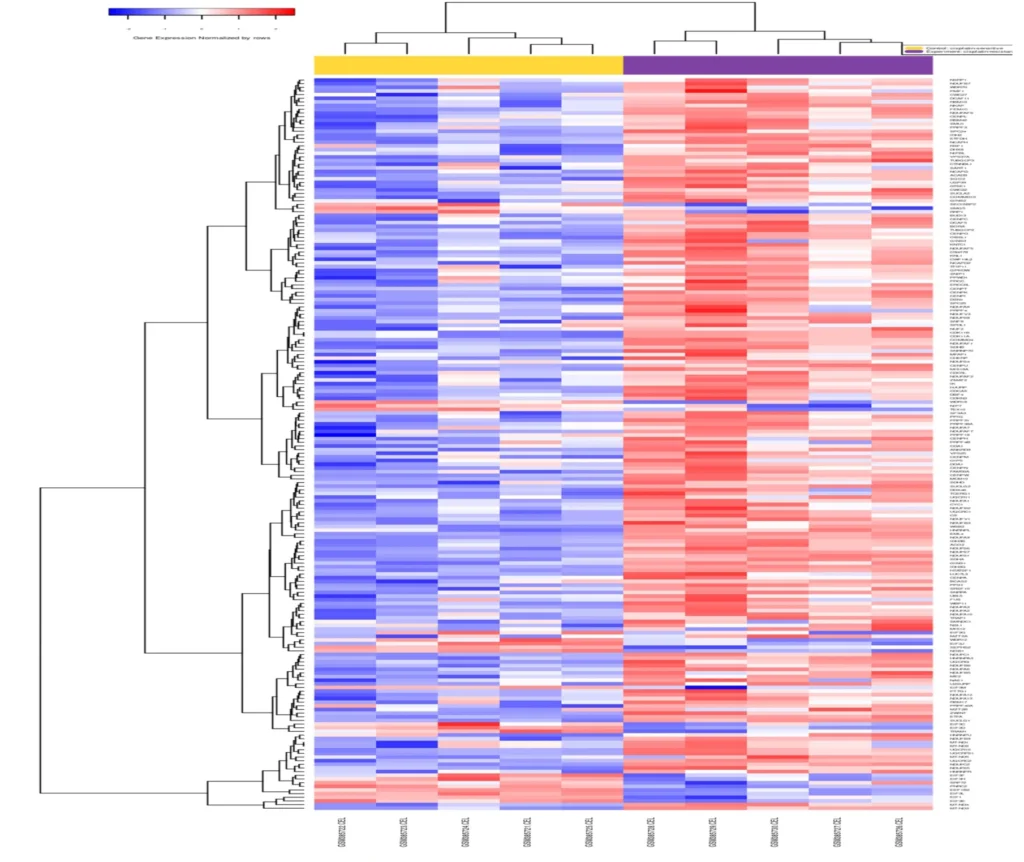
Begin with transcriptomics data (e.g. RNA-seq or microarrays) to find genes that are significantly up- or down-regulated under the condition of interest. These are the “target genes” for further analysis. In parallel, integrate epigenomics data (such as DNA methylation or histone modification profiles) to pinpoint regulatory regions that show differential activity. This ensures that the analysis focuses on genes with functional changes at both expression and regulatory levels. (In our case study, hundreds of genes were found to be differentially expressed between drug-resistant and sensitive samples, providing a starting list for analysis.)
3. Functional and Pathway Enrichment:
Next, perform a functional classification of the DEGs (differentially expressed genes) to understand their biological context. This includes gene ontology (GO) enrichment, disease association analysis, and pathway enrichment using databases like TRANSPATH® (for signal transduction pathways) and others. The goal is to see which pathways or processes are overrepresented in the gene list – for example, are cell cycle genes or DNA damage response pathways enriched? This helps hypothesize which biological themes are important in the condition. (This step is often done using statistical tests to find which pathways are significantly enriched with the DEGs.)
4. Promoter/Enhancer Analysis to Find Key TFs:
Using the combined transcriptomic and epigenomic data, analyze the promoter and enhancer regions of the DEGs to identify which transcription factors (TFs) might be regulating them. Tools like TRANSFAC® (a database of transcription factor binding motifs) and algorithms such as MATCH™ and Composite Module Analyst (CMA) are employed to scan the gene regulatory regions for enriched TF binding sites . The epigenomics data (e.g. DNA methylation changes in promoters) can be used here to focus on regulatory regions that are open or active. This step yields a set of candidate transcriptional regulators that could explain the observed gene expression changes. Essentially, it asks: “Which transcription factors are likely driving the expression of these up/down-regulated genes?”
5. Upstream Pathway Reconstruction (Master Regulators):
The next step is to map out the signaling pathways upstream of those key transcription factors. Using a signaling network database like TRANSPATH® and graph search algorithms, the pipeline traces connections from the TFs to higher-level signaling molecules. This reveals candidate master regulator proteins – typically kinases, receptors, or other signaling nodes – that lie at the tops of pathways controlling the TF activity. These master regulators are essentially the root causes that can trigger the cascade of transcriptional changes. By reconstructing these pathways, one can identify which upstream molecules, if dysregulated (by mutation, epigenetic change, etc.), could lead to the downstream gene expression profile observed. The result is often visualized as a network diagram linking master regulators to transcription factors to target genes.
6. Drug Target Discovery and Candidate Identification:
Finally, the identified master regulators are assessed for their “druggability.” In other words, the pipeline checks which of these upstream nodes are known drug targets or have small molecules that can modulate them. This involves consulting databases like HumanPSD™ (which contains gene–disease–drug information) and applying cheminformatics tools (e.g. PASS for predicting active compounds). The outcome is a list of promising compounds – including existing FDA-approved drugs or experimental molecules – that could potentially interact with the master regulators. This step effectively bridges the gap to therapeutic insight: it suggests which drugs to repurpose or which novel compounds to explore to alter the disease-driving pathways identified. The top candidates are ranked by a combination of factors (known drug–target interactions, predicted activity spectra, etc.), yielding an actionable shortlist of potential treatments.
Overall, this multi-omics “upstream analysis” pipeline starts from raw omics data and ends with concrete hypotheses about key regulators and how to target them. It transforms big data into a mechanistic story:
from differential genes → to key TFs → to master regulators → to drug candidates.

Case Study: Ovarian Cancer Cisplatin Resistance (Transcriptomics + Epigenomics)
To illustrate the power of multi-omics integration, let’s consider as case study analysis of ovarian cancer cisplatin resistance.
In this study, Genome Enhancer was applied to a public dataset of ovarian cancer cells (A2780 cell line) that had developed resistance to cisplatin chemotherapy, compared to the original cisplatin-sensitive cells. The analysis integrated gene expression data (transcriptomics) with DNA methylation profiles (epigenomics). By combining these data, the goal was to unravel the pathways behind drug resistance, essentially to find out which genes and regulators allow cancer cells to survive cisplatin.
Data and Analysis: The transcriptomic analysis identified several hundred genes with altered expression in cisplatin-resistant cells versus sensitive cells (~300 genes were up-regulated and ~300 were down-regulated in the resistant cells). These differentially expressed genes (DEGs) underwent functional enrichment analysis, which indicated that pathways related to cell proliferation, DNA repair, and signaling were impacted – clues that these processes might be involved in the resistance mechanism. At the same time, the DNA methylation data revealed changes in regulatory regions of the genome (such as promoters of certain genes becoming demethylated or hypermethylated), suggesting epigenetic reprogramming accompanies the resistance.

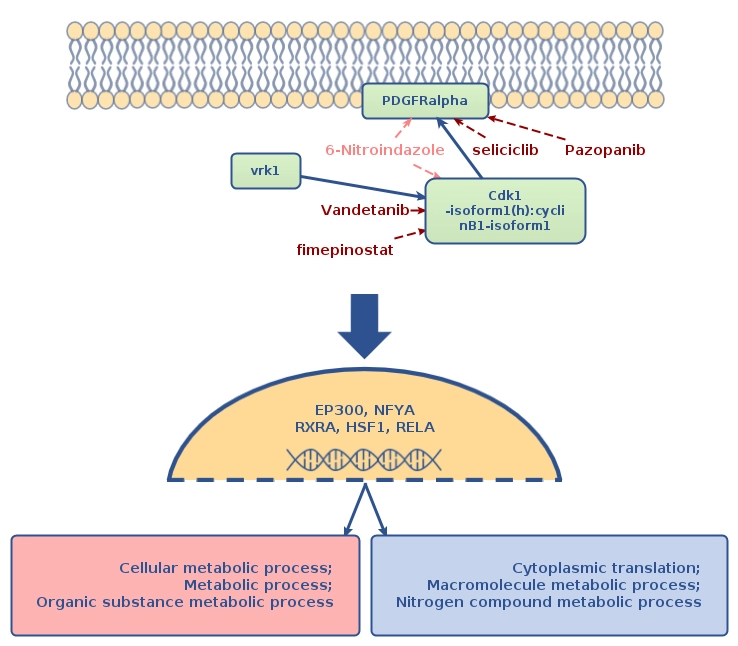
In the next step, Genome Enhancer performed a promoter analysis on the DEGs (aided by the methylation data to focus on relevant regulatory DNA regions). This revealed several transcription factors whose binding sites were statistically overrepresented, implying they are likely driving the expression changes in the resistant cells. Notably, the analysis highlighted factors such as EP300, NF-YA, RXRA, RELA, and HSF1 – transcriptional regulators that could be orchestrating the observed gene expression program. These factors make biological sense: for instance, EP300 is a histone acetyltransferase/co-activator that can loosen chromatin structure (potentially activated in response to epigenetic changes), and NF-YA is a subunit of a key transcription factor (NF-Y) involved in cell cycle and stress response. The identification of these TFs gave the first clues about which regulatory circuits are active in cisplatin resistance.
The crucial insight, however, came from upstream pathway analysis. Genome Enhancer mapped the signaling networks upstream of the identified TFs to find the master regulator nodes. The analysis pinpointed a set of high-level regulators that could be considered the “master switches” of cisplatin resistance.
Among the top findings were:
– PDGFRA – the platelet-derived growth factor receptor alpha (a receptor tyrosine kinase).
– VRK1 – vaccinia-related kinase 1 (a nuclear serine/threonine kinase).
– CDK1–Cyclin B1 complex – the cyclin-dependent kinase 1 with its Cyclin B1 partner (a core driver of cell cycle G2/M transition).
These molecules stood out as critical upstream players that might control the activity of many downstream genes and pathways in the resistant cells. The analysis suggests that signaling through PDGFRA, VRK1, and the CDK1/Cyclin B1 axis contributes to the cancer cell resistance of cisplatin, by ultimately activating the transcription factors (like NF-Y, RELA, etc.) that change gene expression in favor of survival. This makes PDGFRA and Cyclin B1 (CCNB1) particularly interesting: PDGFRA is a growth factor receptor often implicated in cancer cell growth and EMT, while Cyclin B1–CDK1 is essential for cell division, which implies that resistant cells may bypass cisplatin damage by increase of pro-proliferative and pro-survival programs.
A druggability screen of the master regulators yielded a list of potential drugs and compounds that could counteract the resistance. Notably, the analysis suggested pazopanib, a multi-kinase inhibitor (which targets PDGFRA among others), as a promising repurposable drug. It also highlighted fimepinostat (an investigational PI3K/HDAC inhibitor), and standard chemotherapy agents like paclitaxel and etoposide as potential combination or alternative treatments . The presence of known drugs (e.g. paclitaxel, commonly used in ovarian cancer treatment) in the list provides validation, while also proposing new options (pazopanib, fimepinostat) that researchers can further explore to overcome cisplatin resistance.

Overall, the case study demonstrates how integrating transcriptomics and epigenomics can yield biologically insightful and clinically relevant results. We moved from a list of hundreds of changed genes to a clear hypothesis of which master regulators are orchestrating those changes, and even to suggestions of which drugs might target those master regulators. Importantly, this was achieved with an automated pipeline, showing the value of AI-enhanced tools in parsing multi-omics complexity.
The analysis not only confirmed known players (like cell cycle kinases) in chemo-resistance but also uncovered new candidate targets (like PDGFRA and VRK1) that merit further investigation. By mapping the regulatory landscape of cisplatin-resistant ovarian cancer cells, researchers can now design more informed experiments – for instance, testing PDGFRA inhibitors or CDK1 inhibitors to see if they resensitize cells to cisplatin.

Conclusion:
Multi-omics integration for pathway discovery provides a powerful, unbiased way to identify key molecular pathways and targets in complex diseases. By analyzing gene expression changes alongside epigenetic modifications, and tying them into known signaling networks, one can derive a mechanistic understanding that guides therapeutic strategies. In our example, it led to the identification of master regulatory molecules and potential drug candidates to overcome chemotherapy resistance.
This systems biology approach can be applied to many research scenarios where understanding the “wiring” of cellular processes is essential.
For further details or to discuss how Genome Enhancer can support your research, contact us at [email protected].
Get free reports and case studies to your Email
