Identification of Master regulators within geneXplain platform
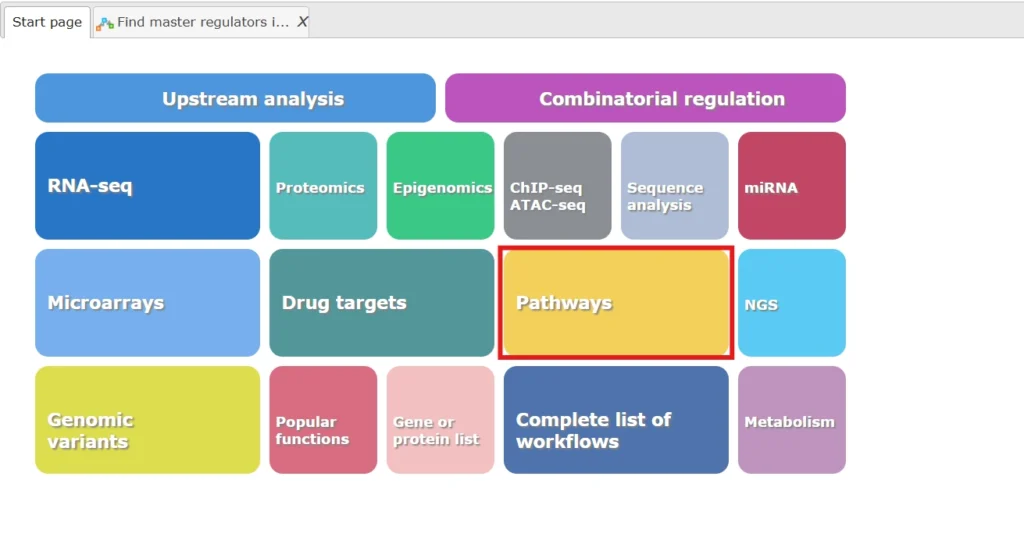
The geneXplain platform offers multiple methods and workflows for identifying master regulators associated with a given gene of interest. A wide range of pathway analysis options is available, all of which can be conveniently accessed from the platform’s start page.
Find Master Regulators in networks (Geneways)
Potential master regulators of the processes analyzed in a typical experiment can be identified with the aid of pathway databases. The geneXplain platform supports work with the TRANSPATH database (license required) or with the public GeneWays database.
Here we demonstrate the workflow to analyze networks using Geneways database with a free genexplain platform account. The workflow can be accessed from the start page.
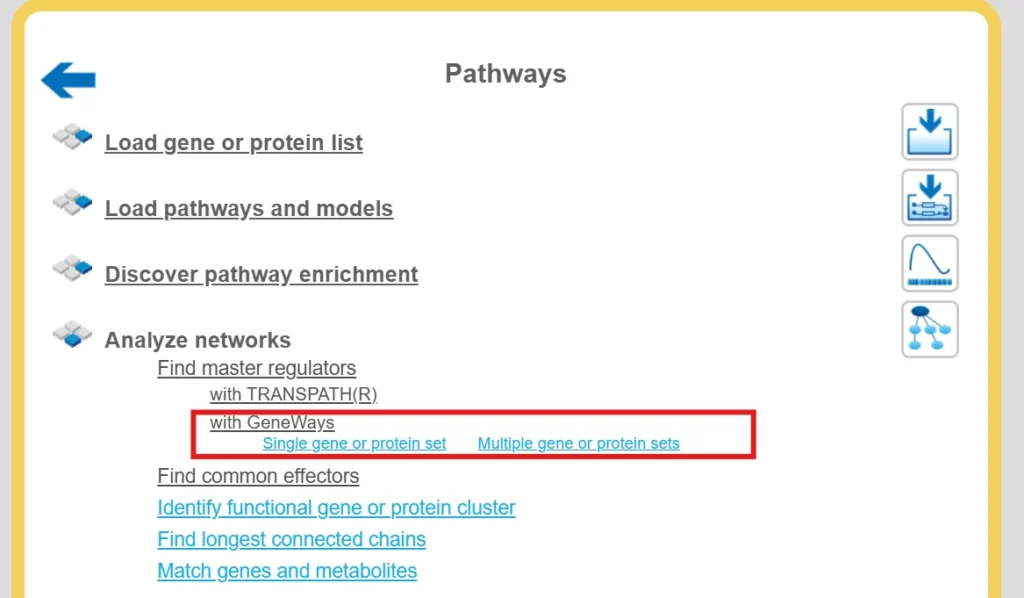
Alternatively it can be opened using the link.
The default page for the workflow looks as shown below:
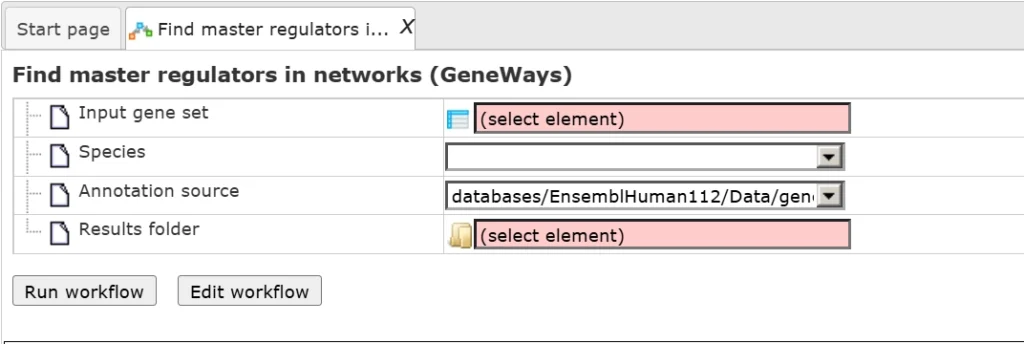
This workflow is designed to find important master regulators in signal transduction pathways. Here, a search for master regulators is done based on the network of the GeneWays database with a maximum radius of 4 steps upstream of an input gene set, a default cutoff for Score at 0.2, for FDR at 0.05, and for Z-score at 1.0.
As input we use an Ensembl gene table, which can be accessed from here.
To run the workflow, drag and drop the input file, select the output path and output file name and press ‘Run’.
The results folder contains several files.
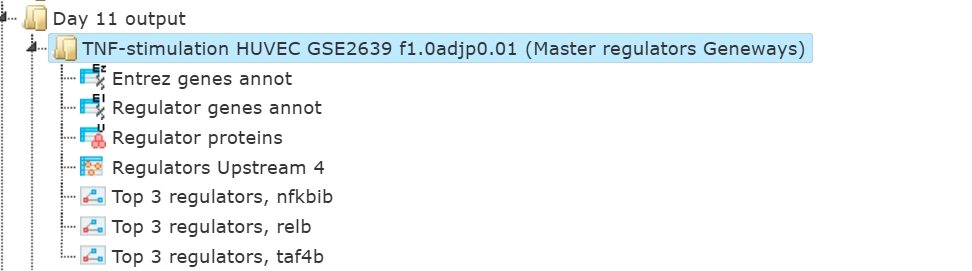
The primary result table Regulators upstream 4 () is a list of master regulatory molecules that were identified at the distance up to 4 steps upstream of the input molecules. Each master regulatory molecule is characterized by a Score, Z-score, FDR, and Ranks Sum.
- Score
The score value of each master regulatory molecule reflects how well this molecule is connected with other molecules in the database, and how many molecules from the input list are present in the network of this master molecule. The higher the Score value, the better this molecule is connected in the database, and the more “Hits” from the input list are present in the network of this molecule. By default, only the molecules with Score > 0.2 are shown in the output.
- Z-score
The Z-score value reflects how specific each master molecule is for the input list. The higher the Z-score value for a molecule, the more specific this molecule is for the input list, and the lesser is the probability to find such a molecule as master regulator in another analysis. Z-score and FDR are calculated based on 1000 random results, for which 1000 random input sets of the same size were generated by the algorithm.
Importantly, Score and Z-score reflect different characteristics of the suggested master regulators in the networks. Molecules with high Score values are well connected in the database, and therefore not very specific for the input list, and correspondingly they have quite moderate Z-score values.
Sorting by Z-score and considering top molecules might be helpful if you are interested in finding novel master regulators which are specific for your input list and generally are not well studied yet. By default, only the molecules with Z-score > 1.0 are shown in the output.
- Ranks sum
This column helps to suggest molecules for which both values, Score and Z-score, are quite good. The column Ranks sum reflects a combination of sorting by Score and by Z-score in the following way.
Upon sorting by Score from biggest values to the lowest, a rank is assigned to the molecules; the molecule with the highest Score has rank 1, etc.
Upon independent sorting by Z-Score from biggest values to lowest, a rank is assigned to the molecules; the molecule with the highest Z-score has rank 1, etc.
Next, for each molecule, the ranks upon sorting by Score and upon sorting by Z-Score are summed up in the column Ranks Sum. The lower the Ranks sum, the more interesting the candidate molecule is, with good Score and good Z-score values.
The column “Reached from set” shows the number of the molecules from the input set that is reached from the respective master regulator, and these molecules are explicitly listed in the column Hit names. The column “Reachable total” presents the total number of molecules that can be reached from the master regulator in the network, independent of the input list.
Having this table opened in the Work Space you can find additional options available, specific for this kind of table. Select one or several rows in the table “Regulators upstream 4” by mouse click, and you can visualize the network of the selected master regulators (, save the network as a list of genes in the Tree Area (
), or save the hits of this network, listed in the column Hit names as a list of genes in the Tree Area (
).
The table Regulator proteins () corresponds to the table Regulators converted into the UniProtKB/Swiss-Prot IDs.
The table Regulator genes () corresponds to the table Regulators converted into the Ensembl IDs and in the table Regulator genes annot (
) the same genes are additionally annotated with gene symbols and gene descriptions.
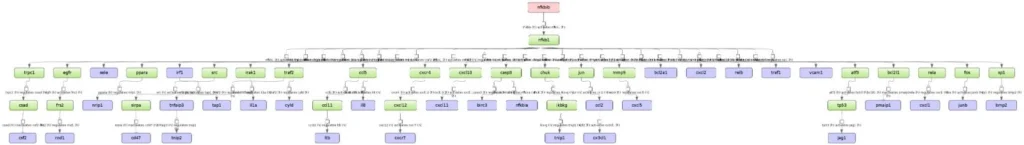
The three diagrams Top 3 regulators () visualize the networks individually for each of three top master regulators.
By default, the top regulators are identified upon sorting the table Regulators upstream 4 () by the column Ranks sum with the lowest rank on top.
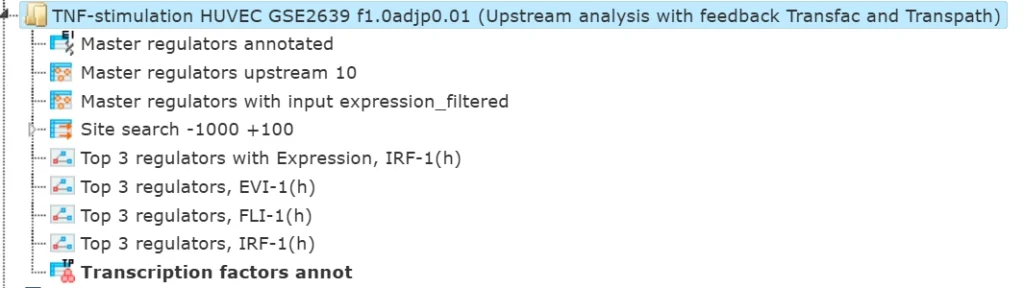
Upstream analysis
The geneXplain upstream analysis is an integrated promoter (TRANSFAC®) and pathway (TRANSPATH®) analysis to discover unanticipated causal relationships in your data. These workflows require licensing to TRANSFAC® and TRANSPATH®.
For demonstration purposes, the same Ensembl input gene which was used above was analyzed using the Upstream Analysis workflow.
The results can be viewed here to better understand the capabilities and output of this workflow.
Genome Enhancer workflow
The same Ensembl input gene was analyzed using the Genome Enhancer pipeline, a fully automated workflow for processing various types of omics data, as explained earlier on Day 9.
You can check the report here.
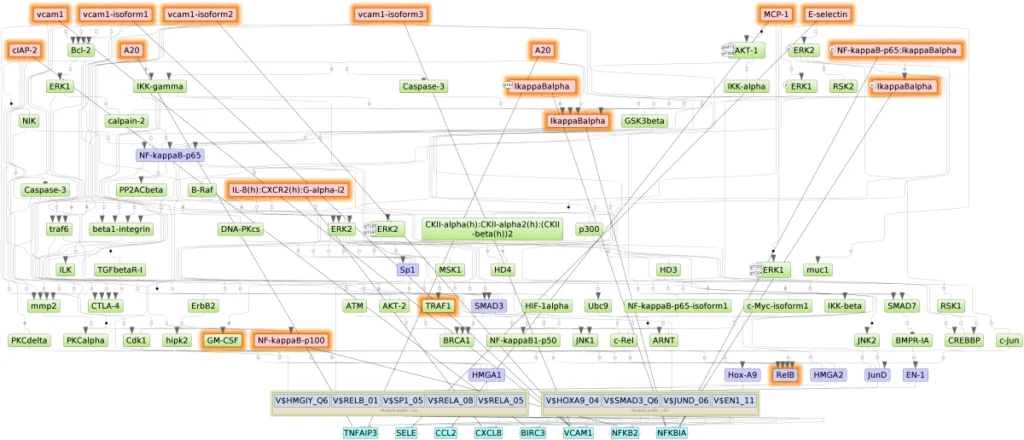
Diagram of intracellular regulatory signal transduction pathways of the list of genes provided as input in TNF LogFC. Master regulators are indicated by red rectangles, transcription factors are blue rectangles, and green rectangles are intermediate molecules, which have been added to the network during the search for master regulators from selected TFs. Orange and blue frames highlight molecules that are encoded by up- and downregulated genes, resp. For a full diagram, check the report here.