Lesson 5. Genome variant analysis
Genomic variants can be uploaded to the platform in different formats. The files uploaded in bed format are shown in the tree area as tracks (![]() ). Genomic variants can be also uploaded as a table, where the ID column contains standard SNP IDs (e.g. rs10010325). When imported into the platform, the tables with this type of ID have a special icon (
). Genomic variants can be also uploaded as a table, where the ID column contains standard SNP IDs (e.g. rs10010325). When imported into the platform, the tables with this type of ID have a special icon (![]() ) in the tree area. An example of such a table can be found here.
) in the tree area. An example of such a table can be found here.
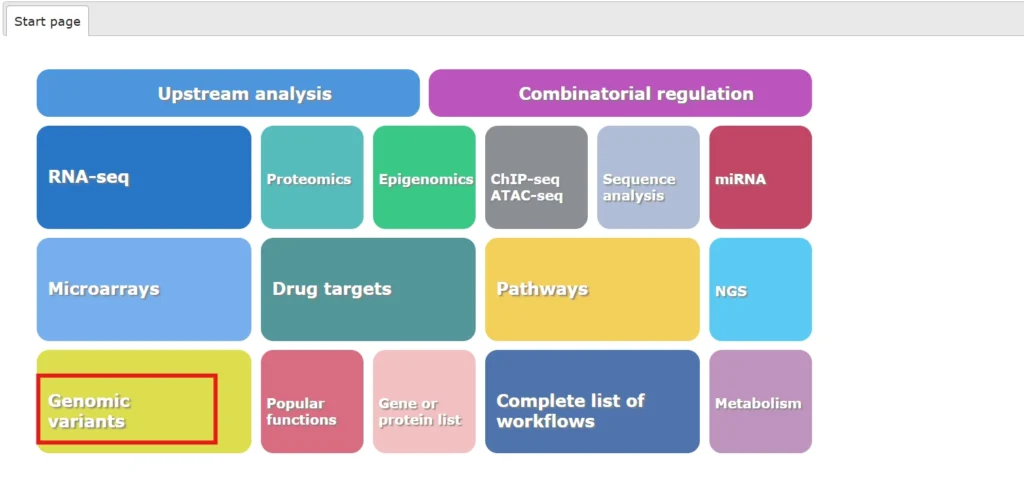
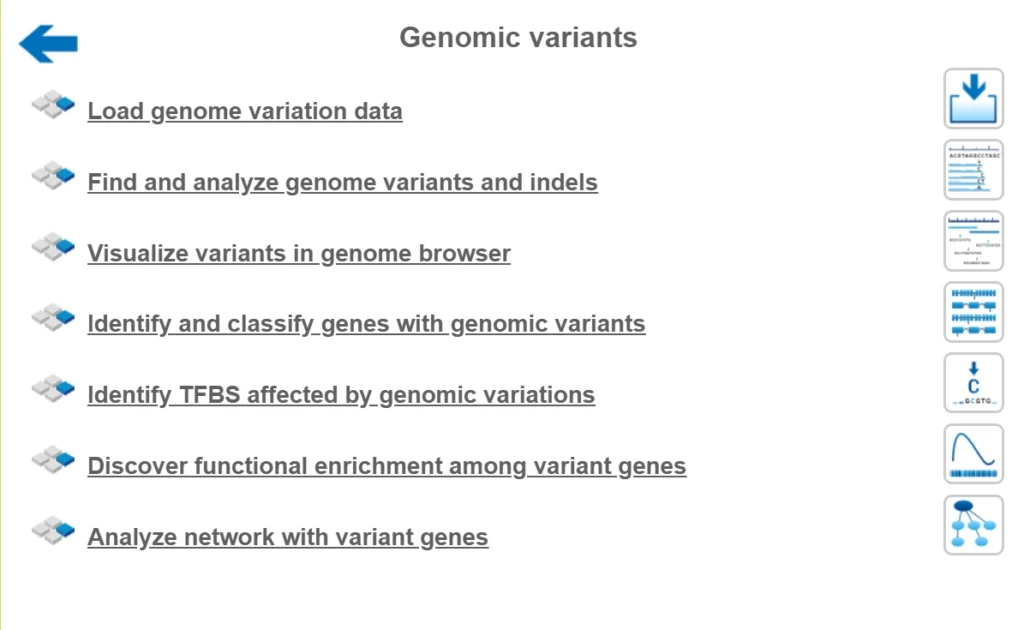
In the geneXplain platform you can access all methods and workflows for processing this type of data from the start page
SNP Matching
NGS DNA sequencing is a powerful analytical method to discover novel SNPs and detect known SNPs. The geneXplain platform provides a unique analysis method termed SNP matching. Using this method and an SNP table (derived after sequencing) as input, the corresponding SNP loci are mapped to Ensembl genes so that you can get an annotated SNP table as output.
Users should supply tables where row identifiers are SNP names like ‘rs11111111’.
The method can be accessed from here.
By default the tool looks like this:
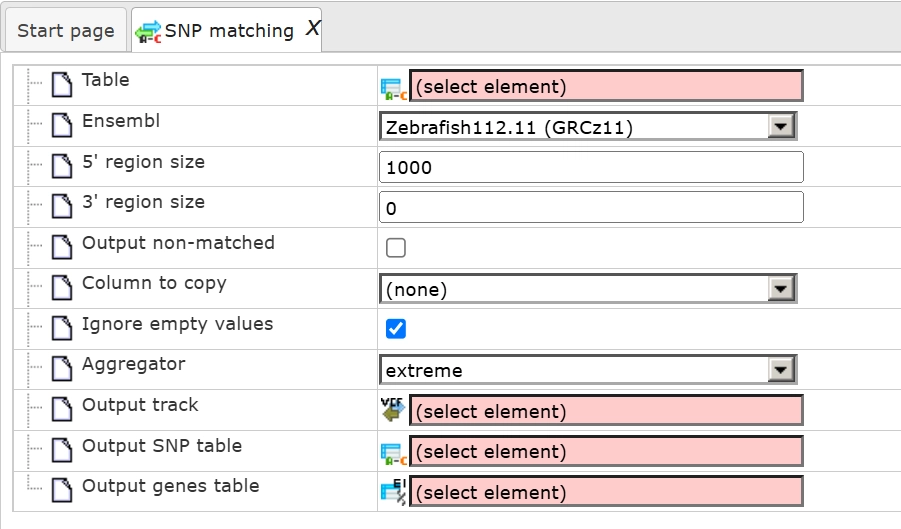
Parameters:
Drag and drop the input table and press run.
The output includes three files that can be further used within the geneXplain platform:
Identify TFBS affected by genomic variations
Enriched TF sites around regulatory SNPs and SIFT analysis
Analysis with GTRD
This workflow is designed to match SNPs on a transcriptional level. One part of the workflow predicts variant effects on transcript level of exons. The other part of the workflow searches for transcription factor binding sites (TFBS), which may be affected by genomic variations (SNPs).
The input form of this workflow, when opened from the Start page, is the following:
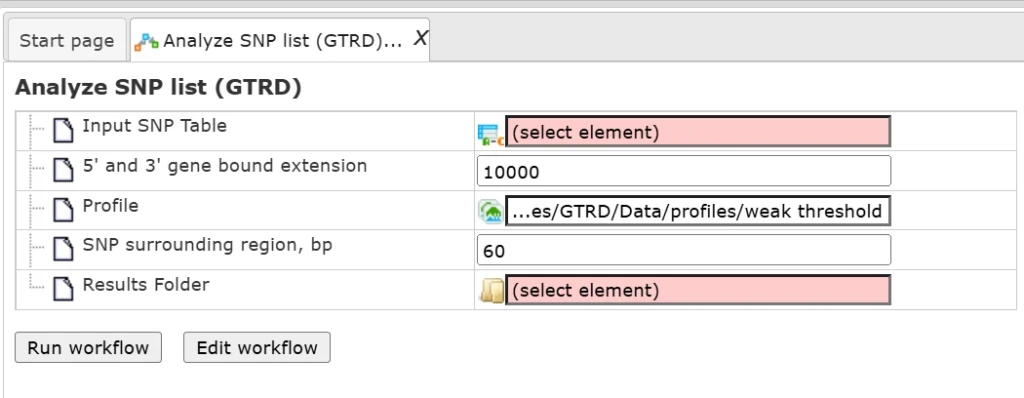
Drag and drop the input file, select the results folder and press ‘Run workflow’.
The input file used in this case can be accessed from here:
The output is a result folder with three subfolders named all SNPs, SNPs in exons and SNPs regulatory, respectively, containing all resulting tables and tracks:
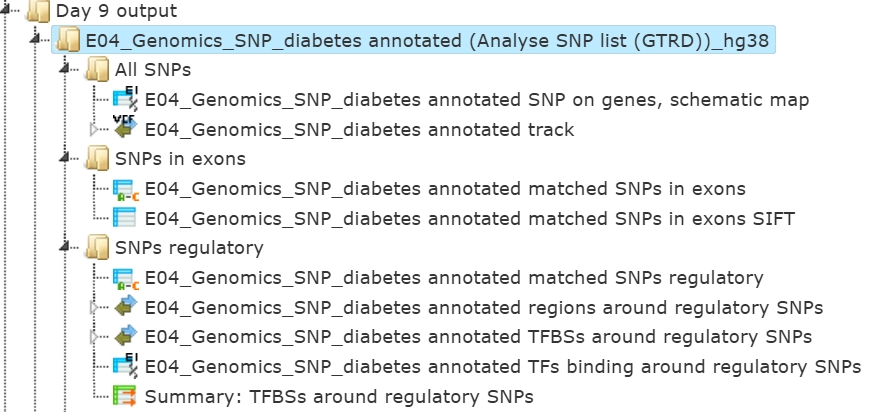
Subfolder All SNPs
This folder includes one gene table and one track.
The table SNPs on genes, schematic map (![]() ) contains all genes that were identified in the region of 10000 bp on both flanks around each SNP. Each row of this table corresponds to one gene; the column ID presents Ensembl gene IDs, and HGNC gene symbols are listed in the column Gene symbol. The title of the last column Schematic also contains the name of the input table. This column represents a schematic view for each gene, where blue boxes correspond to exons, and the lines between exons symbolize introns, drawn in logarithmic scale. SNPs are shown by vertical red lines. This schema provides an overview of SNP location within genes.
) contains all genes that were identified in the region of 10000 bp on both flanks around each SNP. Each row of this table corresponds to one gene; the column ID presents Ensembl gene IDs, and HGNC gene symbols are listed in the column Gene symbol. The title of the last column Schematic also contains the name of the input table. This column represents a schematic view for each gene, where blue boxes correspond to exons, and the lines between exons symbolize introns, drawn in logarithmic scale. SNPs are shown by vertical red lines. This schema provides an overview of SNP location within genes.
A track (![]() ) represents the results of the SNP mapping to genomic positions.
) represents the results of the SNP mapping to genomic positions.
For each SNP the tabulated view of the track contains information about chromosomal location, absolute positions, length, and strand. In the column ‘Type’ the value variation is shown for all SNPs, and in the column ‘Property name’ SNP IDs are shown.
Subfolder SNPs in exons
This folder includes two tables, both present information for those SNPs that are located in exons.
The first table contains general information about SNPs that are located in exons. Each row in this table corresponds to one SNP. The columns Ensembl ID and Gene symbol refer to the gene in which this particular SNP is located. The column Location confirms that all SNPs are located in exons.
The absolute genomic positions of the SNPs are shown in the columns SNP_matching-Chromosome, SNP_matching-Position and SNP_matching-Strand. The column SNP_matching-Allele shows which nucleotide exactly varies at the listed position.
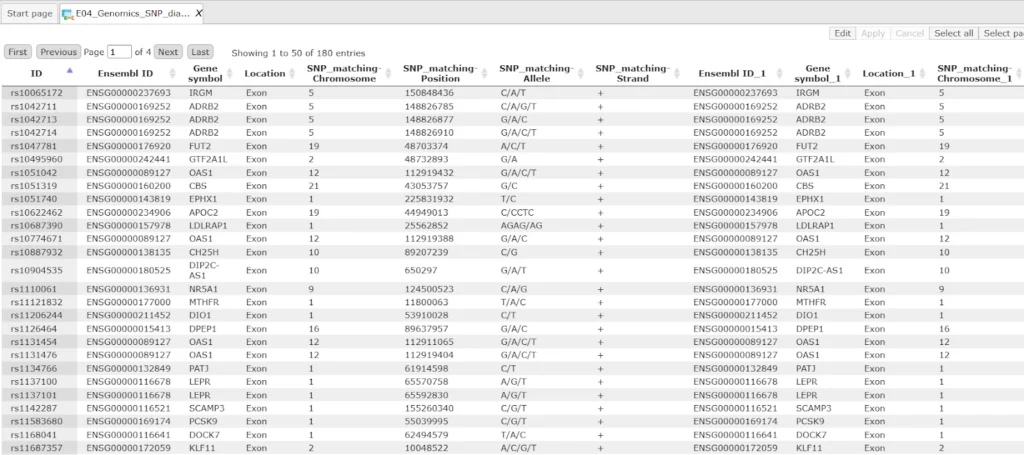
If your input SNP table contains more columns in addition to IDs, all these columns will be preserved and will be added to the right side of this table.
The other table in this subfolder results from the SIFT analysis, and is represented by an icon for a general table.
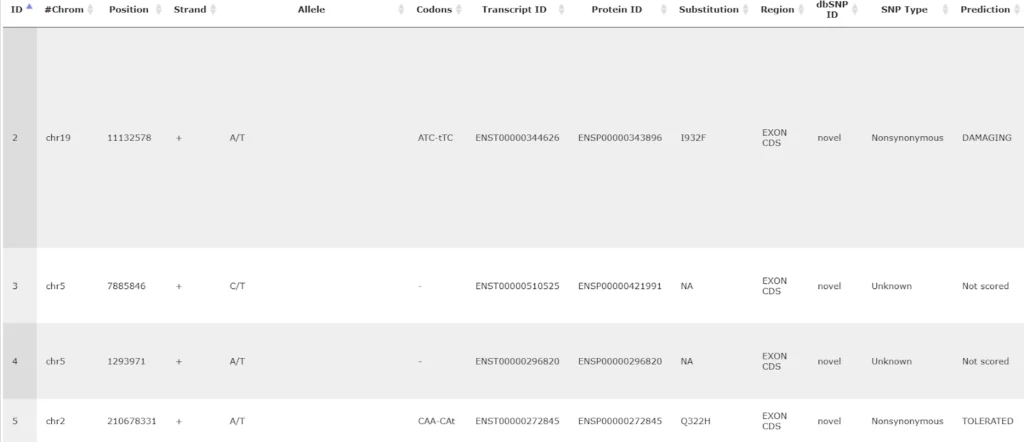
SIFT is a widely accepted method to check whether a particular variation is synonymous or non-synonymous, and in case of a non-synonymous variation whether it is damaging or tolerated.
There are many columns in this table, we will consider the most important ones in the following.
The columns Codons and Substitution show which nucleotide in a codon varies and which amino acid is substituted by which. The column SNP Type shows if it is a synonymous or a non-synonymous variation, and in case of non-synonymous variations the column Prediction shows if it is damaging or tolerated. An extension of this table to its right side is shown below, starting with the column Prediction:
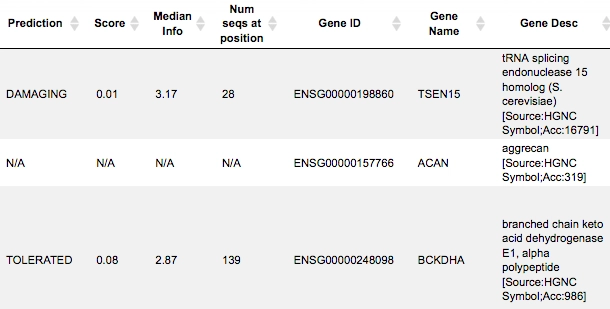
The columns Gene ID, Gene Name, Gene Desc show information about which genes and gene products are affected and might be even damaged by a given variation.
Subfolder SNPs regulatory
This subfolder contains three tables and one track.
The table Summary: TFBSs around regulatory SNPs (![]() ) shown below has been sorted by the values in the Yes-No ratio column.
) shown below has been sorted by the values in the Yes-No ratio column.

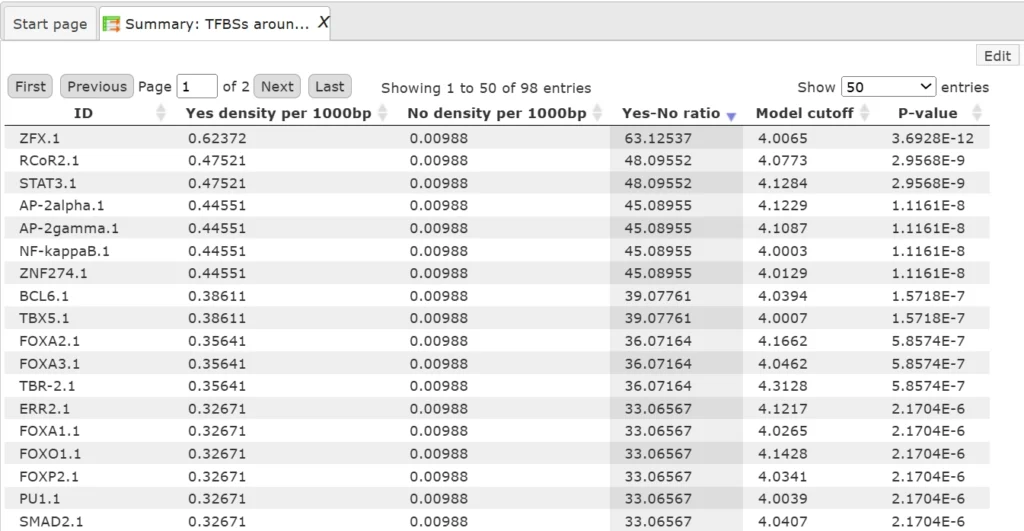
Each row summarizes the information for one PWM. The columns Yes density per 1000bp and No density per 1000bp show the number of matches normalized per 1000 bp length for the sequences around SNPs and in the sequences around random genomic positions, respectively.
The column Yes-No ratio is the ratio of the first two columns. Only matrices with a Yes-No ratio higher than 1 are included in the Summary table. The higher the Yes-No ratio, the higher the enrichment of matches is for the respective matrix in the sequences around regulatory SNPs.
The matrix cutoff values calculated by the program at the optimization step are shown in the column Model cutoff, and the last column shows the P-value of the corresponding event.The table TFs binding around regulatory SNPs (![]() ) includes transcription factors (TFs) that are associated with the PWMs listed in the table above, and each row shows details for one TF, including its Ensembl gene ID (column ID), gene symbol, gene description of the corresponding TF (columns Gene description, Gene symbol).
) includes transcription factors (TFs) that are associated with the PWMs listed in the table above, and each row shows details for one TF, including its Ensembl gene ID (column ID), gene symbol, gene description of the corresponding TF (columns Gene description, Gene symbol).
The column Site model ID shows the identifier of the PWM associated with this TF, and several further columns repeat information that is also shown in the table above.
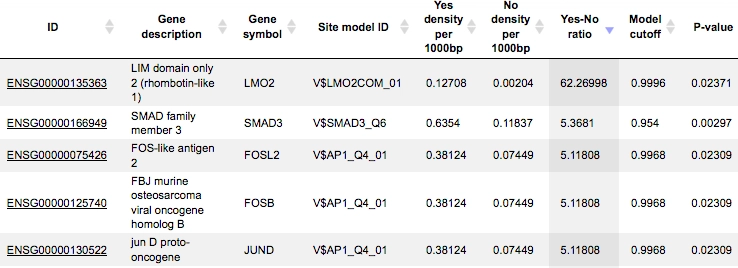
These TFs are suggested to have their binding sites in close proximity or even overlapping with SNPs, and their binding might be affected by a given SNP.
The track TFBSs around regulatory SNPs (![]() ) gives information about the genomic positions of the identified TFBSs.
) gives information about the genomic positions of the identified TFBSs.
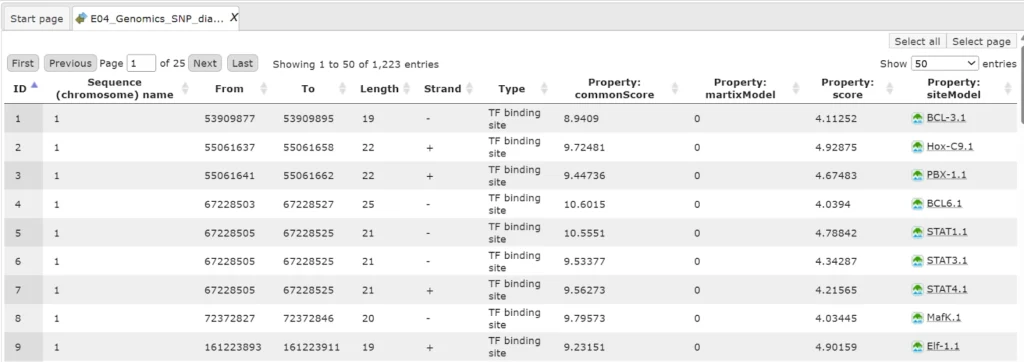
Each row presents details for an individual TFBS. The columns Sequence (chromosome) name, From, To, Length and Strand show the genomic location of the match including chromosome number, start and end positions, strand, and length of the match.
The column Type contains information about the type of the elements; in this case all matches are assigned the type TF binding site.
Further columns keep information about the site model producing each match (column Property:siteModel) as well as a score of the core (column Property:coreScore), and a score for the whole site model (column Property:score).
Analysis with TRANSFAC
The same workflow as with GTRD is also available with profiles from a TRANSFAC license.
The example output for Analyze SNP workflow with TRANSFAC can be accessed from here.
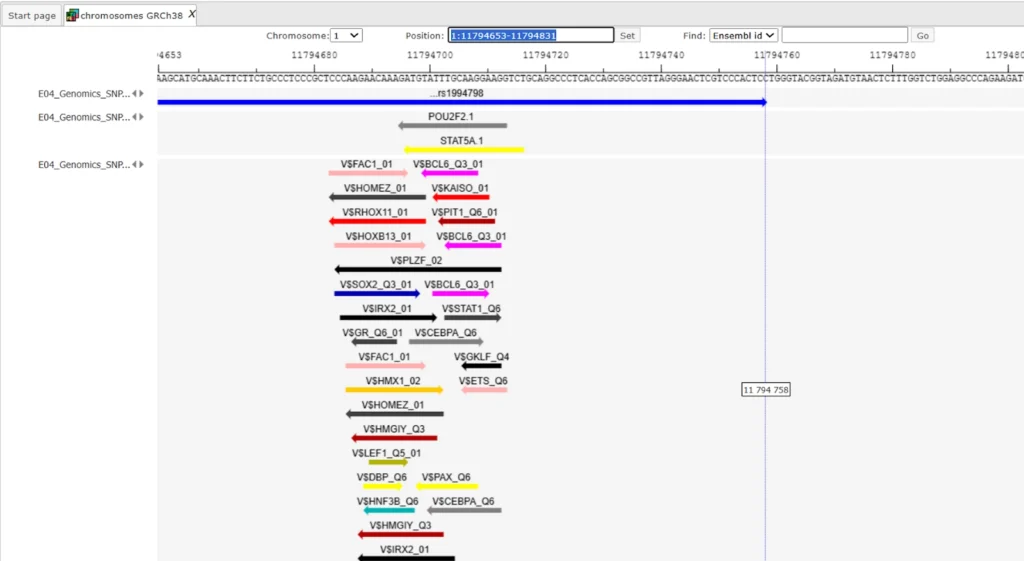
Here we show the genome browser view of binding sites around SNPs.
Analyze SNP list (TRANSFAC(R) and TRANSPATH(R))
This workflow is designed to match SNPs on transcriptional and on translational level. You can access the workflow with a valid TRANSFAC Pathways license.
One part of the workflow identifies enriched transcription factor binding sites (TFBS), which may be affected by genomic variations (SNPs).
The other part of the workflow predicts variant effects on protein functions based on SNPs and predicts potential pathway alterations.
Workflow results can be seen here.
For more information on the workflow write to us at [email protected]
SNP analysis via Genome Enhancer
The SNP input table can also be used as an input in Genome Enhancer.
Genome Enhancer is a fully automated pipeline for patient omics data analysis, which identifies prospective drug targets and corresponding treatments by reconstructing the molecular mechanism of the studied pathology.
You can check a sample Genome Enhancer report here.
Why a License Matters
A licensed TRANSFAC® package gives you:
- Complete and current datasets unavailable in free versions.
- Regular updates and professional support from the geneXplain team.
- Possible Integration with TRANSPATH® and HumanPSD™ for pathway, disease, and drug insights.
- Reproducible, publication-ready results trusted in academia, pharma, and translational research.
To summarize, licensing TRANSFAC® is not just an upgrade—it’s an investment in scientific accuracy, data integrity, and discovery speed.
It provides the depth, precision, and interpretability required to confidently move from sequence data to biological understanding and translational outcomes.
