What is Pathway Analysis?

This may have different flavors:

Therefore, the geneXplain platform provides an empirical way to identify the specific combination of sites that characterizes a given set of co-regulating promoters.

Most commonly, it is of interest to know which signaling or metabolic pathways are activated under certain experimental conditions.

A slightly different question may be to find out which pathways were used to express a certain observed phenotype.

Both types of problems can be conveniently addressed with the geneXplain platform.

Approaches to pathway analysis

To find out whether among all genes induced in an experiment those are overrepresented that encode components of a certain pathway, conventional gene set enrichment analysis (GSEA) and related methods can be applied. In such an approach, however, topological information about the pathway is lost.

More sophisticated is to search for those networks, pathways or paths where many linked components have been induced. This is provided by the platform option “Cluster by shortest path”. A visualization of differential expression onto a known pathway is shown in the figure below. These known pathways may be documented in the databases TRANSPATH® (manually curated information; example shown) or GeneWays (compiled by text mining).

Learn more about the geneXplain platform.

Click image for an enlarged view of the visualization of the clustered paths comprising a maximal number of differentially expressed genes, highlighted by a customizable color code between most significantly down- (blue) or up-regulated (orange) genes in two different experiments (left/right half of the colored boxes around the gene names). Edge labels indicate the number of steps between the shown nodes. In this example, mapping was done onto the GeneWays database network.

When starting from a set of differentially expressed genes or their products, resp., it is frequently of interest to see what is their common activator. Such convergence points of upstream pathways are potential master regulators, or key nodes.

The next figure shows how the upstream paths of a set of proteins (blue) converge in one master regulator (here: AKT1, red). The database behind this analysis is TRANSPATH®. It can be seen how a section of the whole pathway (overview in the lower right window) is amenable to editing in the main work area. Detailed information about a selected component, like the mTor complex in this example, are displayed in the Info Box at the lower left corner.

Click image for an enlarged view.

This type of analysis can be combined with the visualization of differentially expressed genes and their expression behavior, in the same way as shown above.

Click for an enlarged view of the customizable interface.
Click image for the complete view of the exported network picture.

Graph layout

Proper handling of the layout is a particular challenge when displaying networks. The implementation in the geneXplain platform ensures an easy and fast reorganization of the layout between a hierarchical, force-directed and orthogonal layout scheme.

Click image for an enlarged view either of the hierarchical, the force-directed or the orthogonal layout.

Graph search

Any diagram constructed from TRANSPATH or GeneWays contents can be manually expanded to molecules that are connected to a selected node (see figure below). Subsequent automatic redesign will refine the appearance of the graph according to the chosen layout style.

graph_search-2

Click image for an enlarged view of the original small network with IL-10 as key node, the network expanded for further IL-10 targets, and the re-arranged visualization after re-arranged, force-directed layout.

Joining graphs

Several diagrams, e.g. pointing at different master regulators (figure below, red nodes), can be easily joined.

Click image for an enlarged view of the “join diagrams” option, or the resulting joined network.

Key publications for pathway analysis

Stegmaier P., Voss N., Meier T., Kel A., Wingender E., Borlak J. (2011) Advanced computational biology methods identify molecular switches for malignancy in an EGF mouse model of liver cancer. PLoS ONE 6, e17738. PubMed.

Stegmaier P., Krull M., Voss N., Kel A., Wingender E. (2010) Molecular mechanistic associations of human diseases. BMC Syst. Biol. 4, 1024. PubMed.

Zubarev R.A., Nielsen M.L., Fung E.M., Savitski M.M., Kel-Margoulis O., Wingender E., Kel A. (2008) Identification of dominant signaling pathways from proteomics expression data. J. Proteom. 71, 89-96. PubMed.

Michael H., Hogan J., Kel A., Kel-Margoulis O., Schacherer F., Voss N., Wingender E. (2008) Building a knowledge base for systems pathology. Brief. Bioinform. 9, 518-531. PubMed.

Kel A., Voss N., Jauregui R., Kel-Margoulis O., Wingender E. (2006) Beyond microarrays: Find key transcription factors controlling signal transduction pathways. BMC Bioinformatics 7 Suppl. 2, S13. PubMed.

Benefits

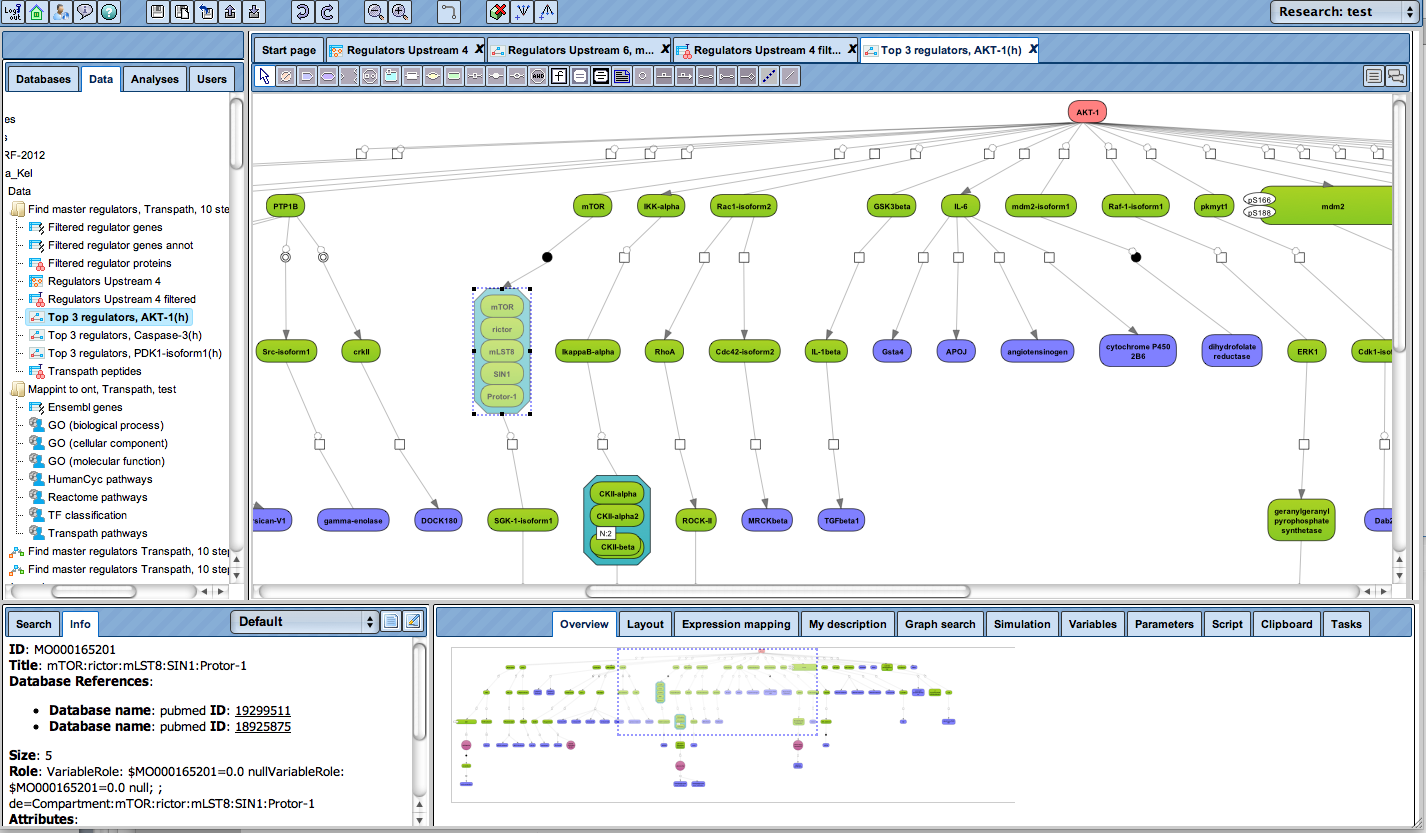
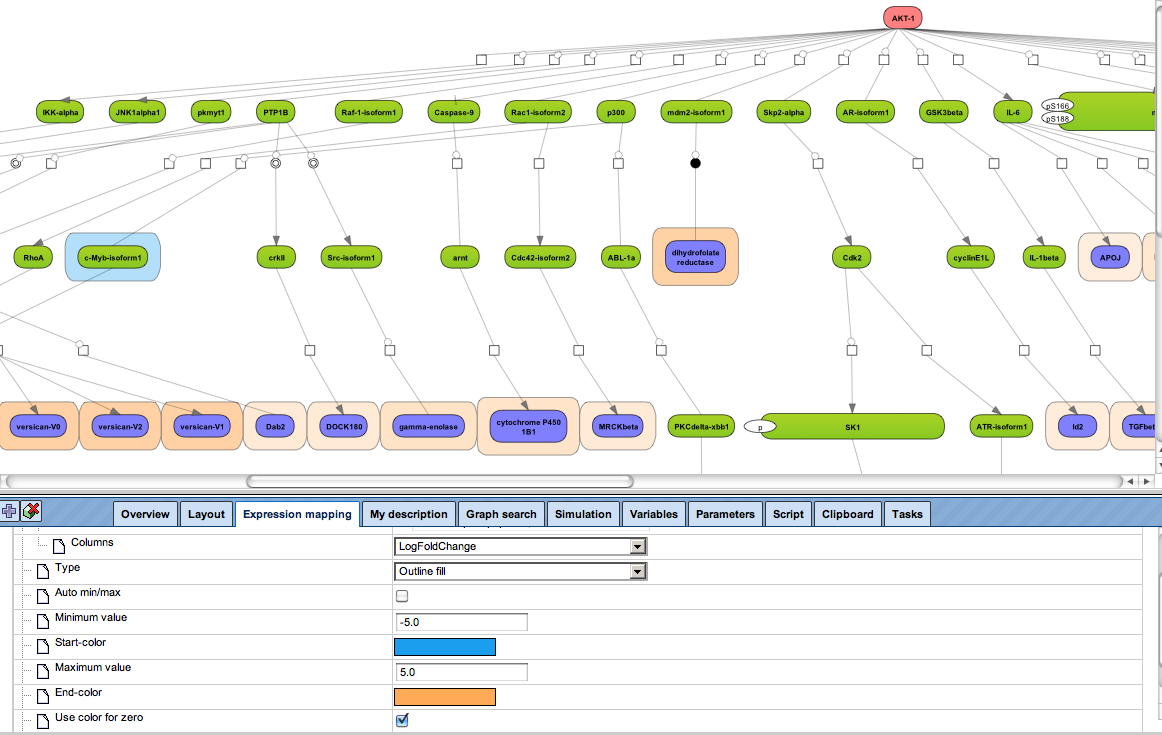
Get a fast overview about the pathways affected in your experiment.

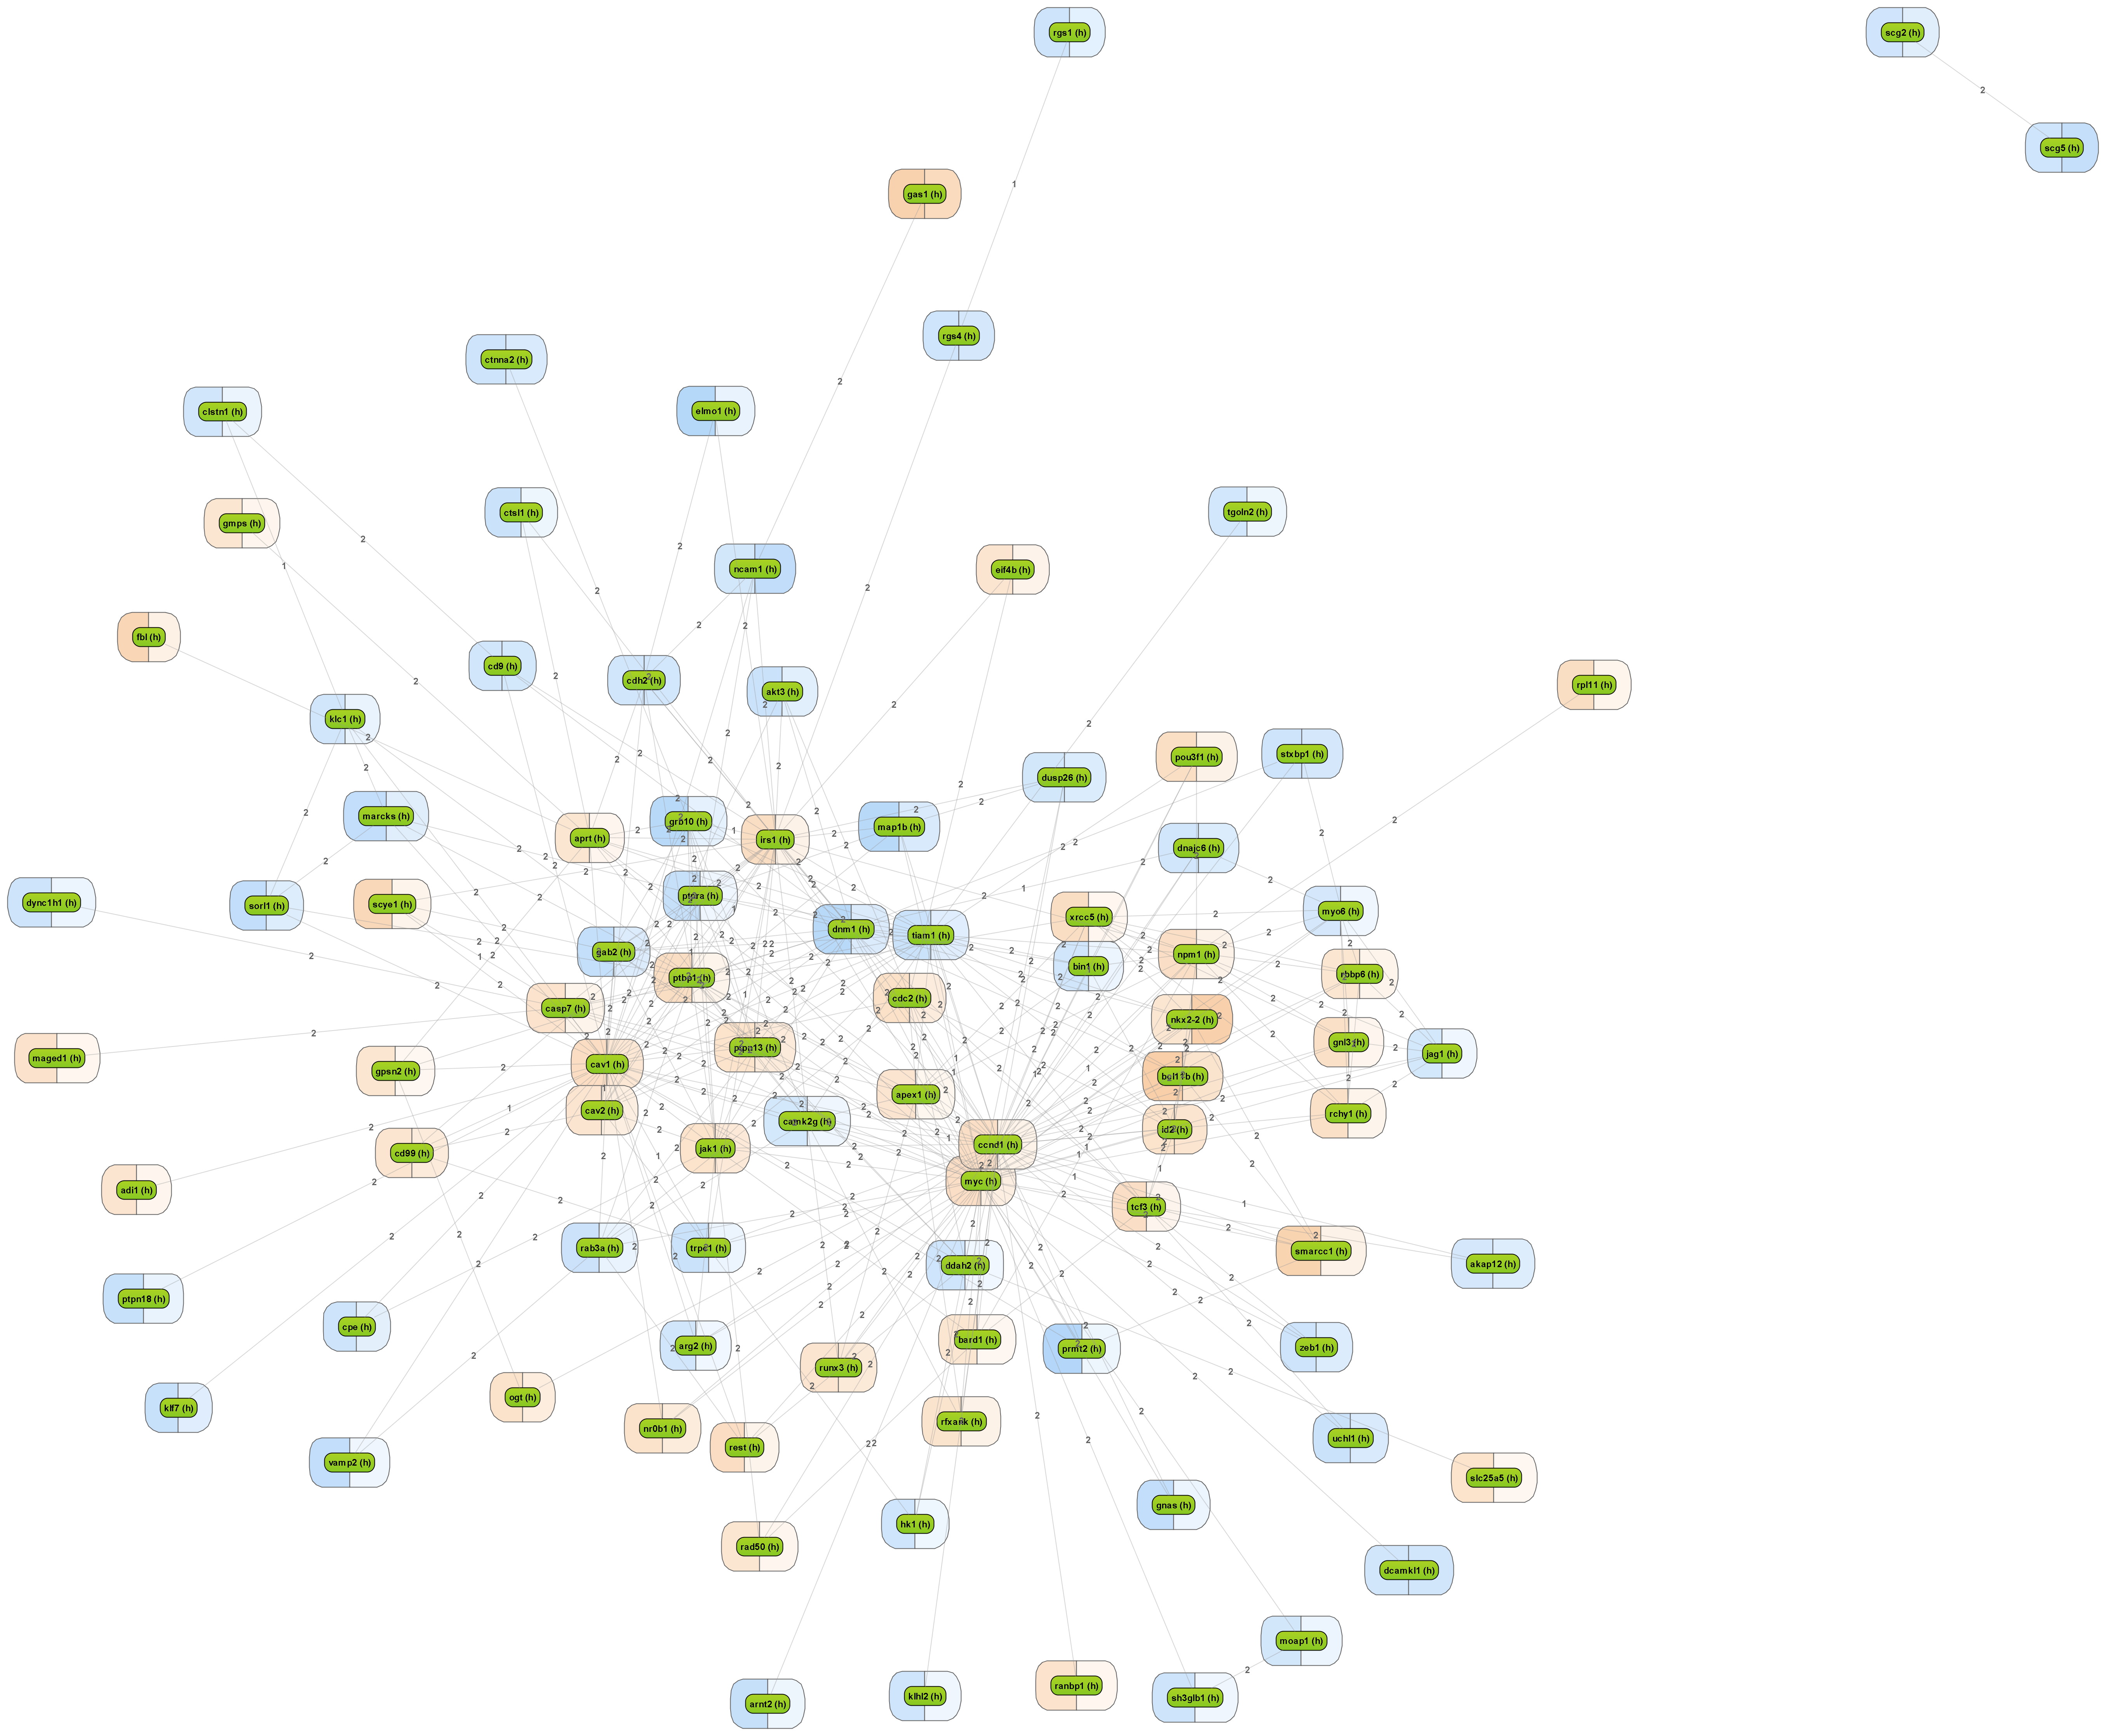
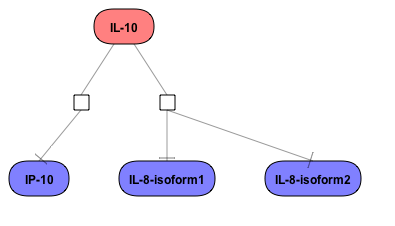
Get an immediate indication about common effector molecules.

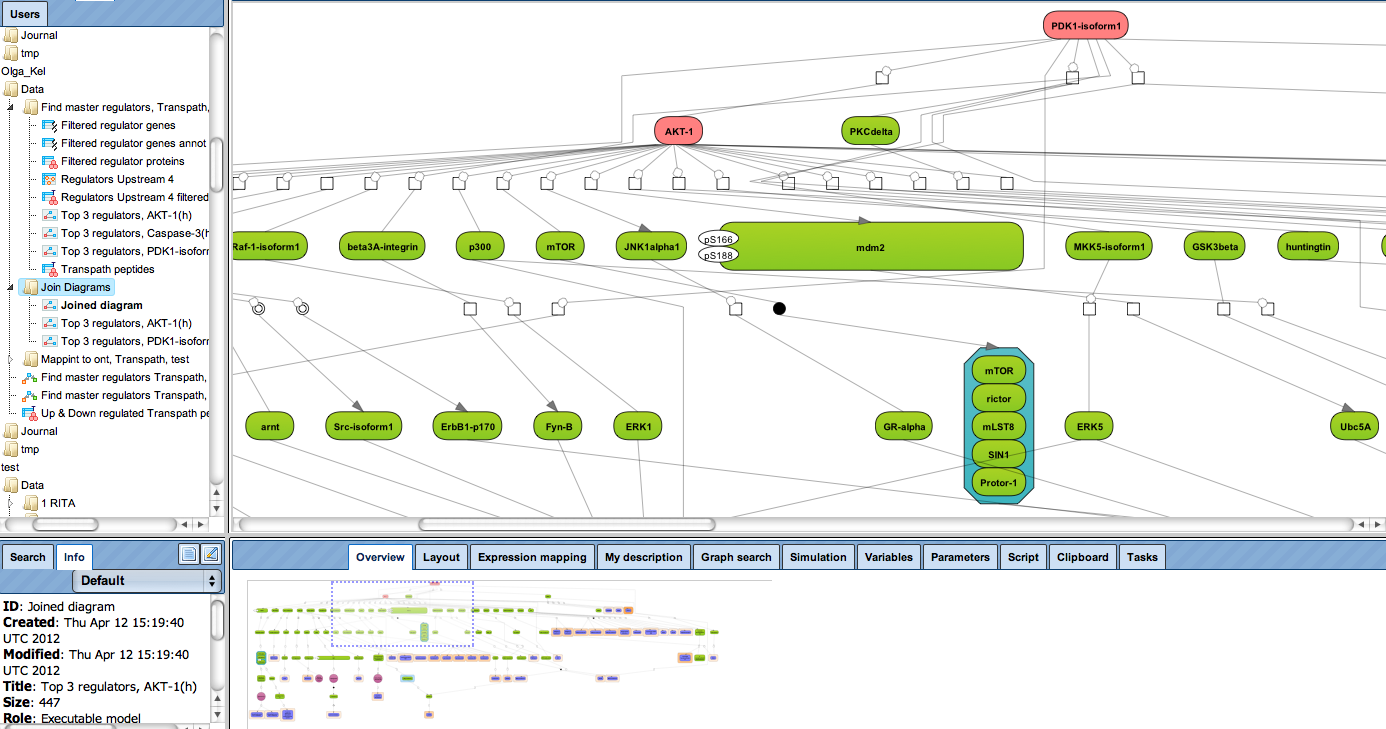
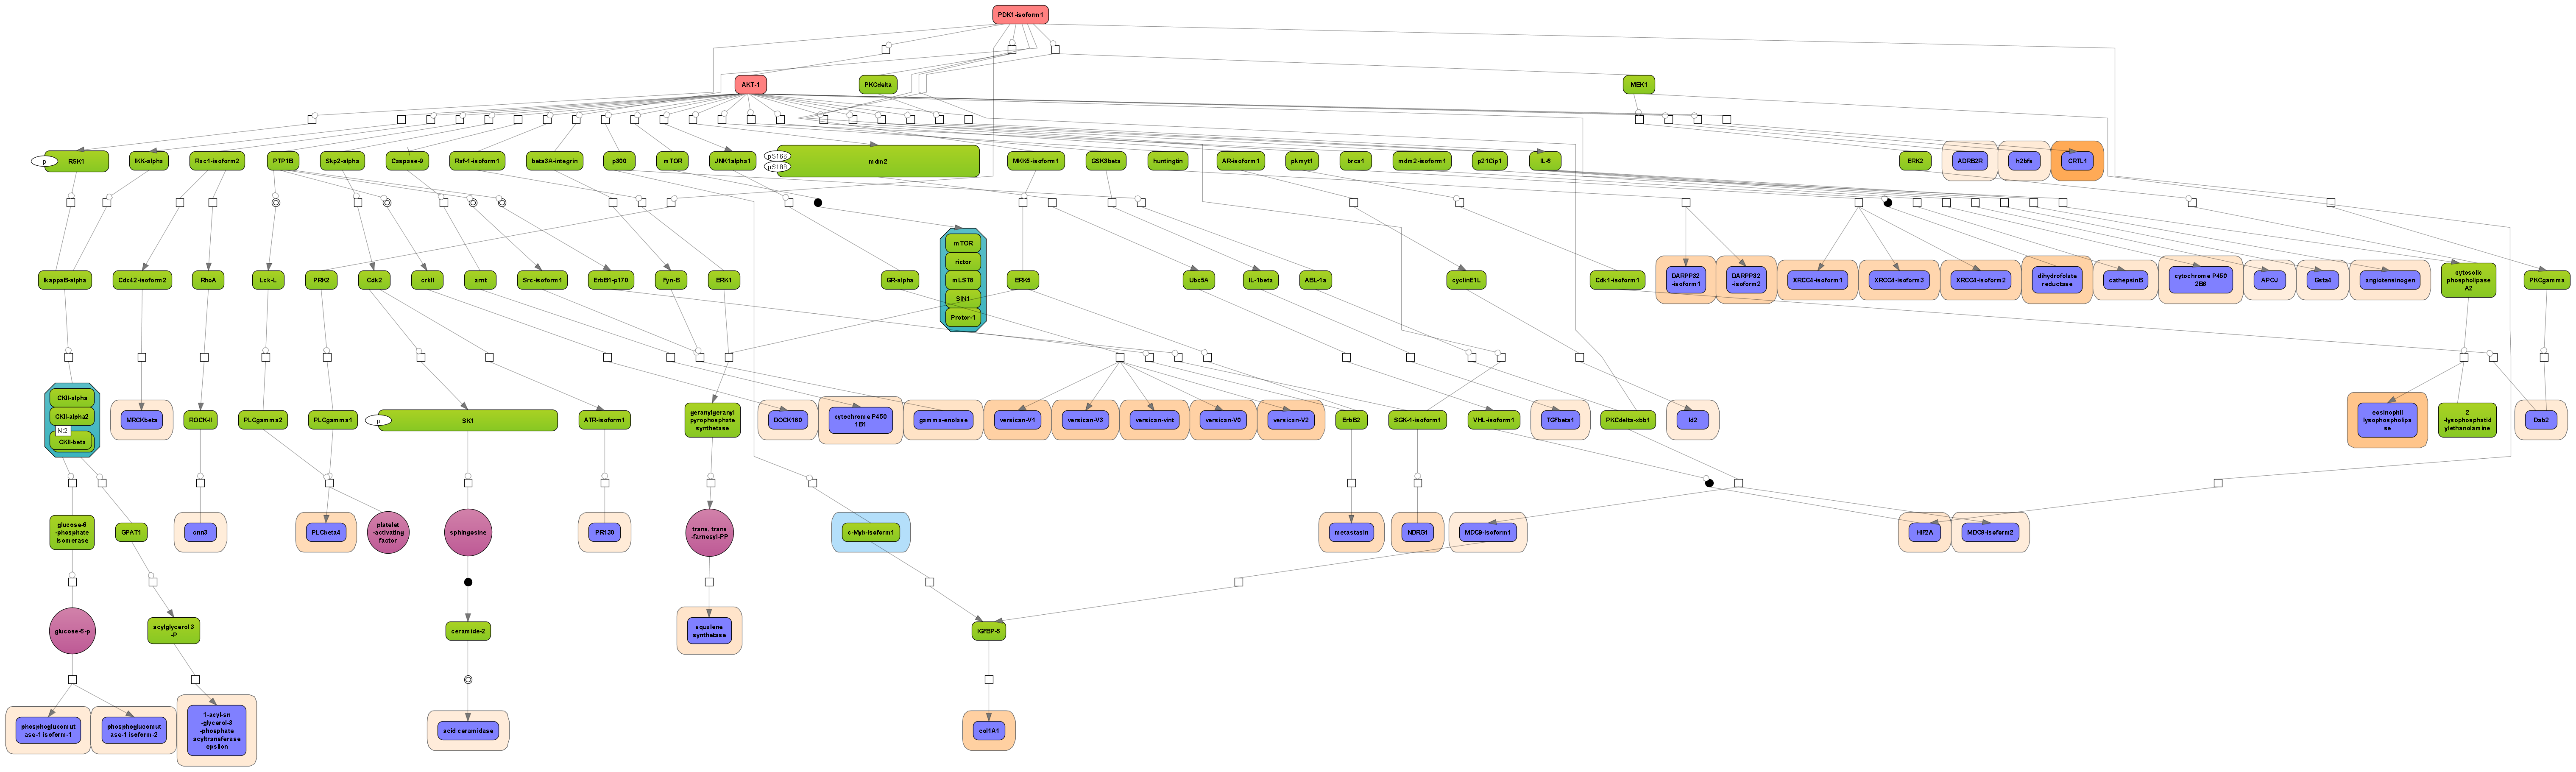
Receive a reliable prognosis about potential upstream master regulators.

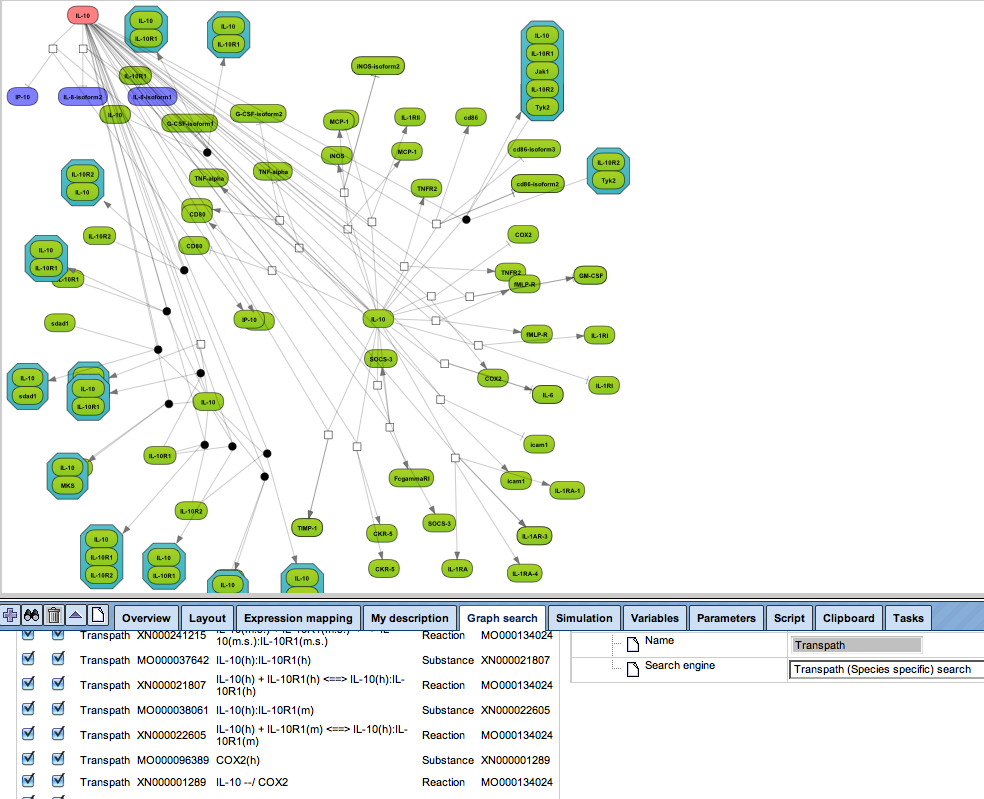
Flexibly work with manually curated pathway data (TRANSPATH) or with information automatically extracted from scientific literature (GeneWays).

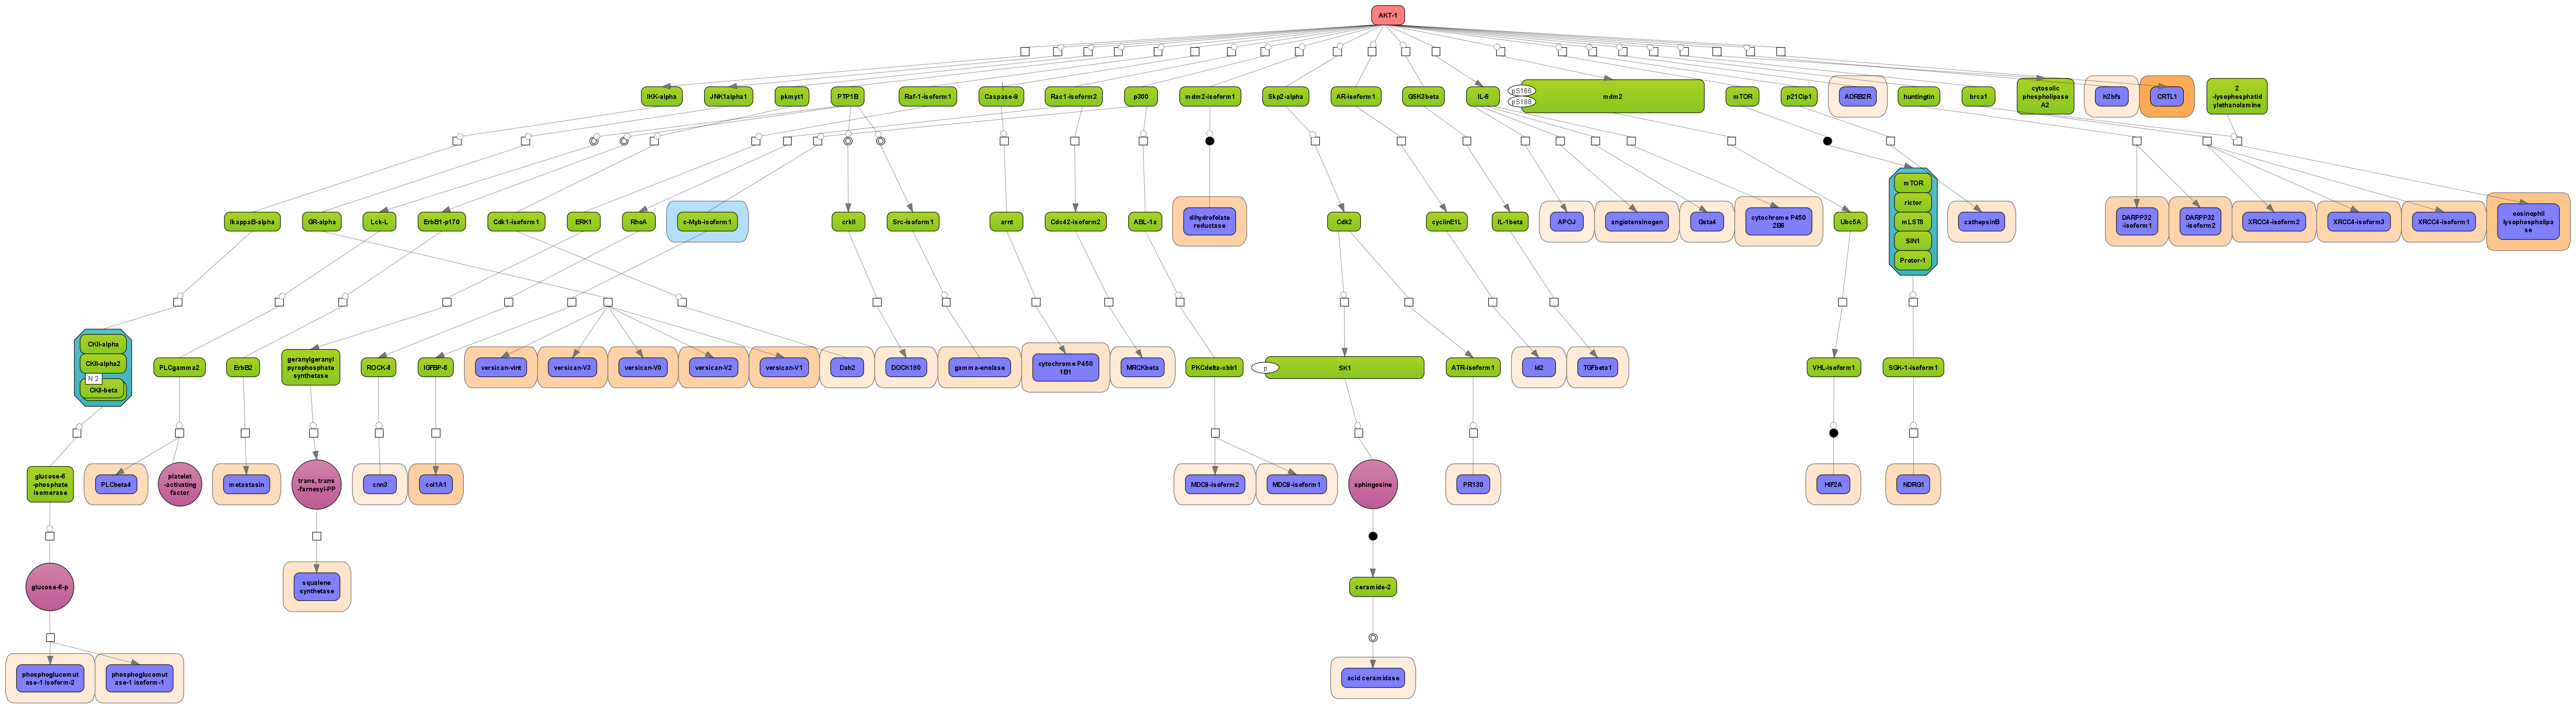
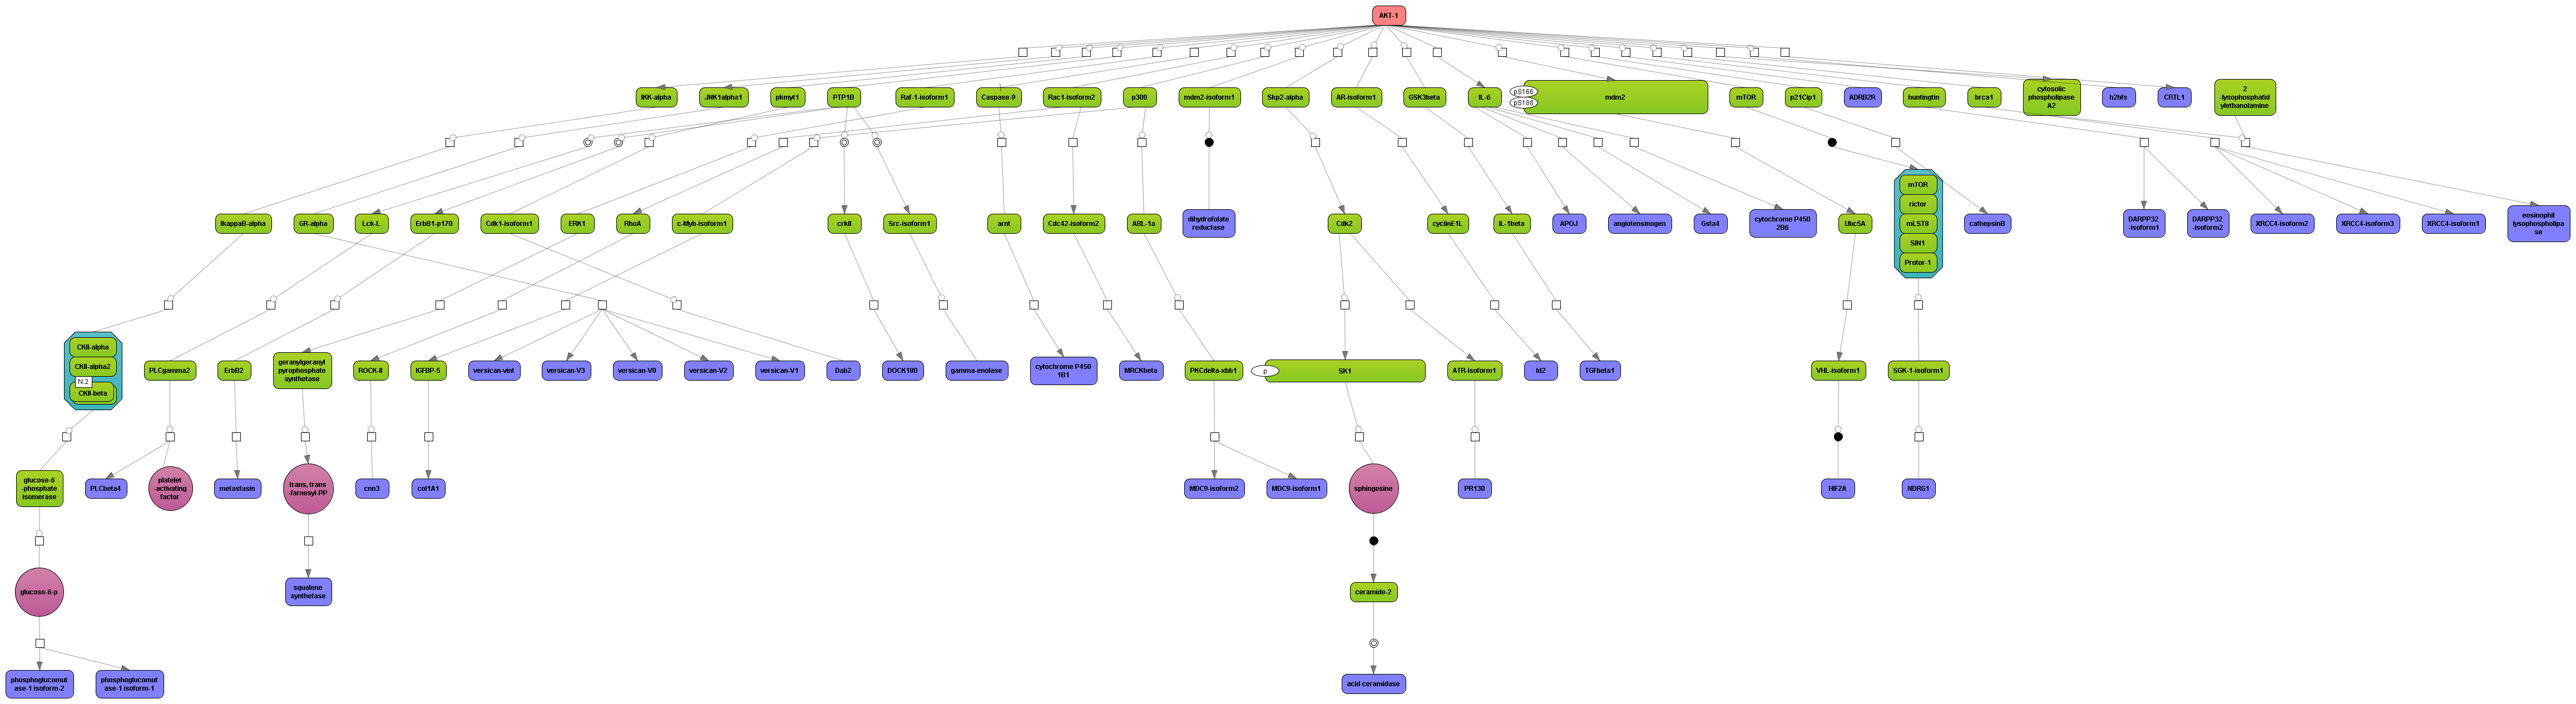
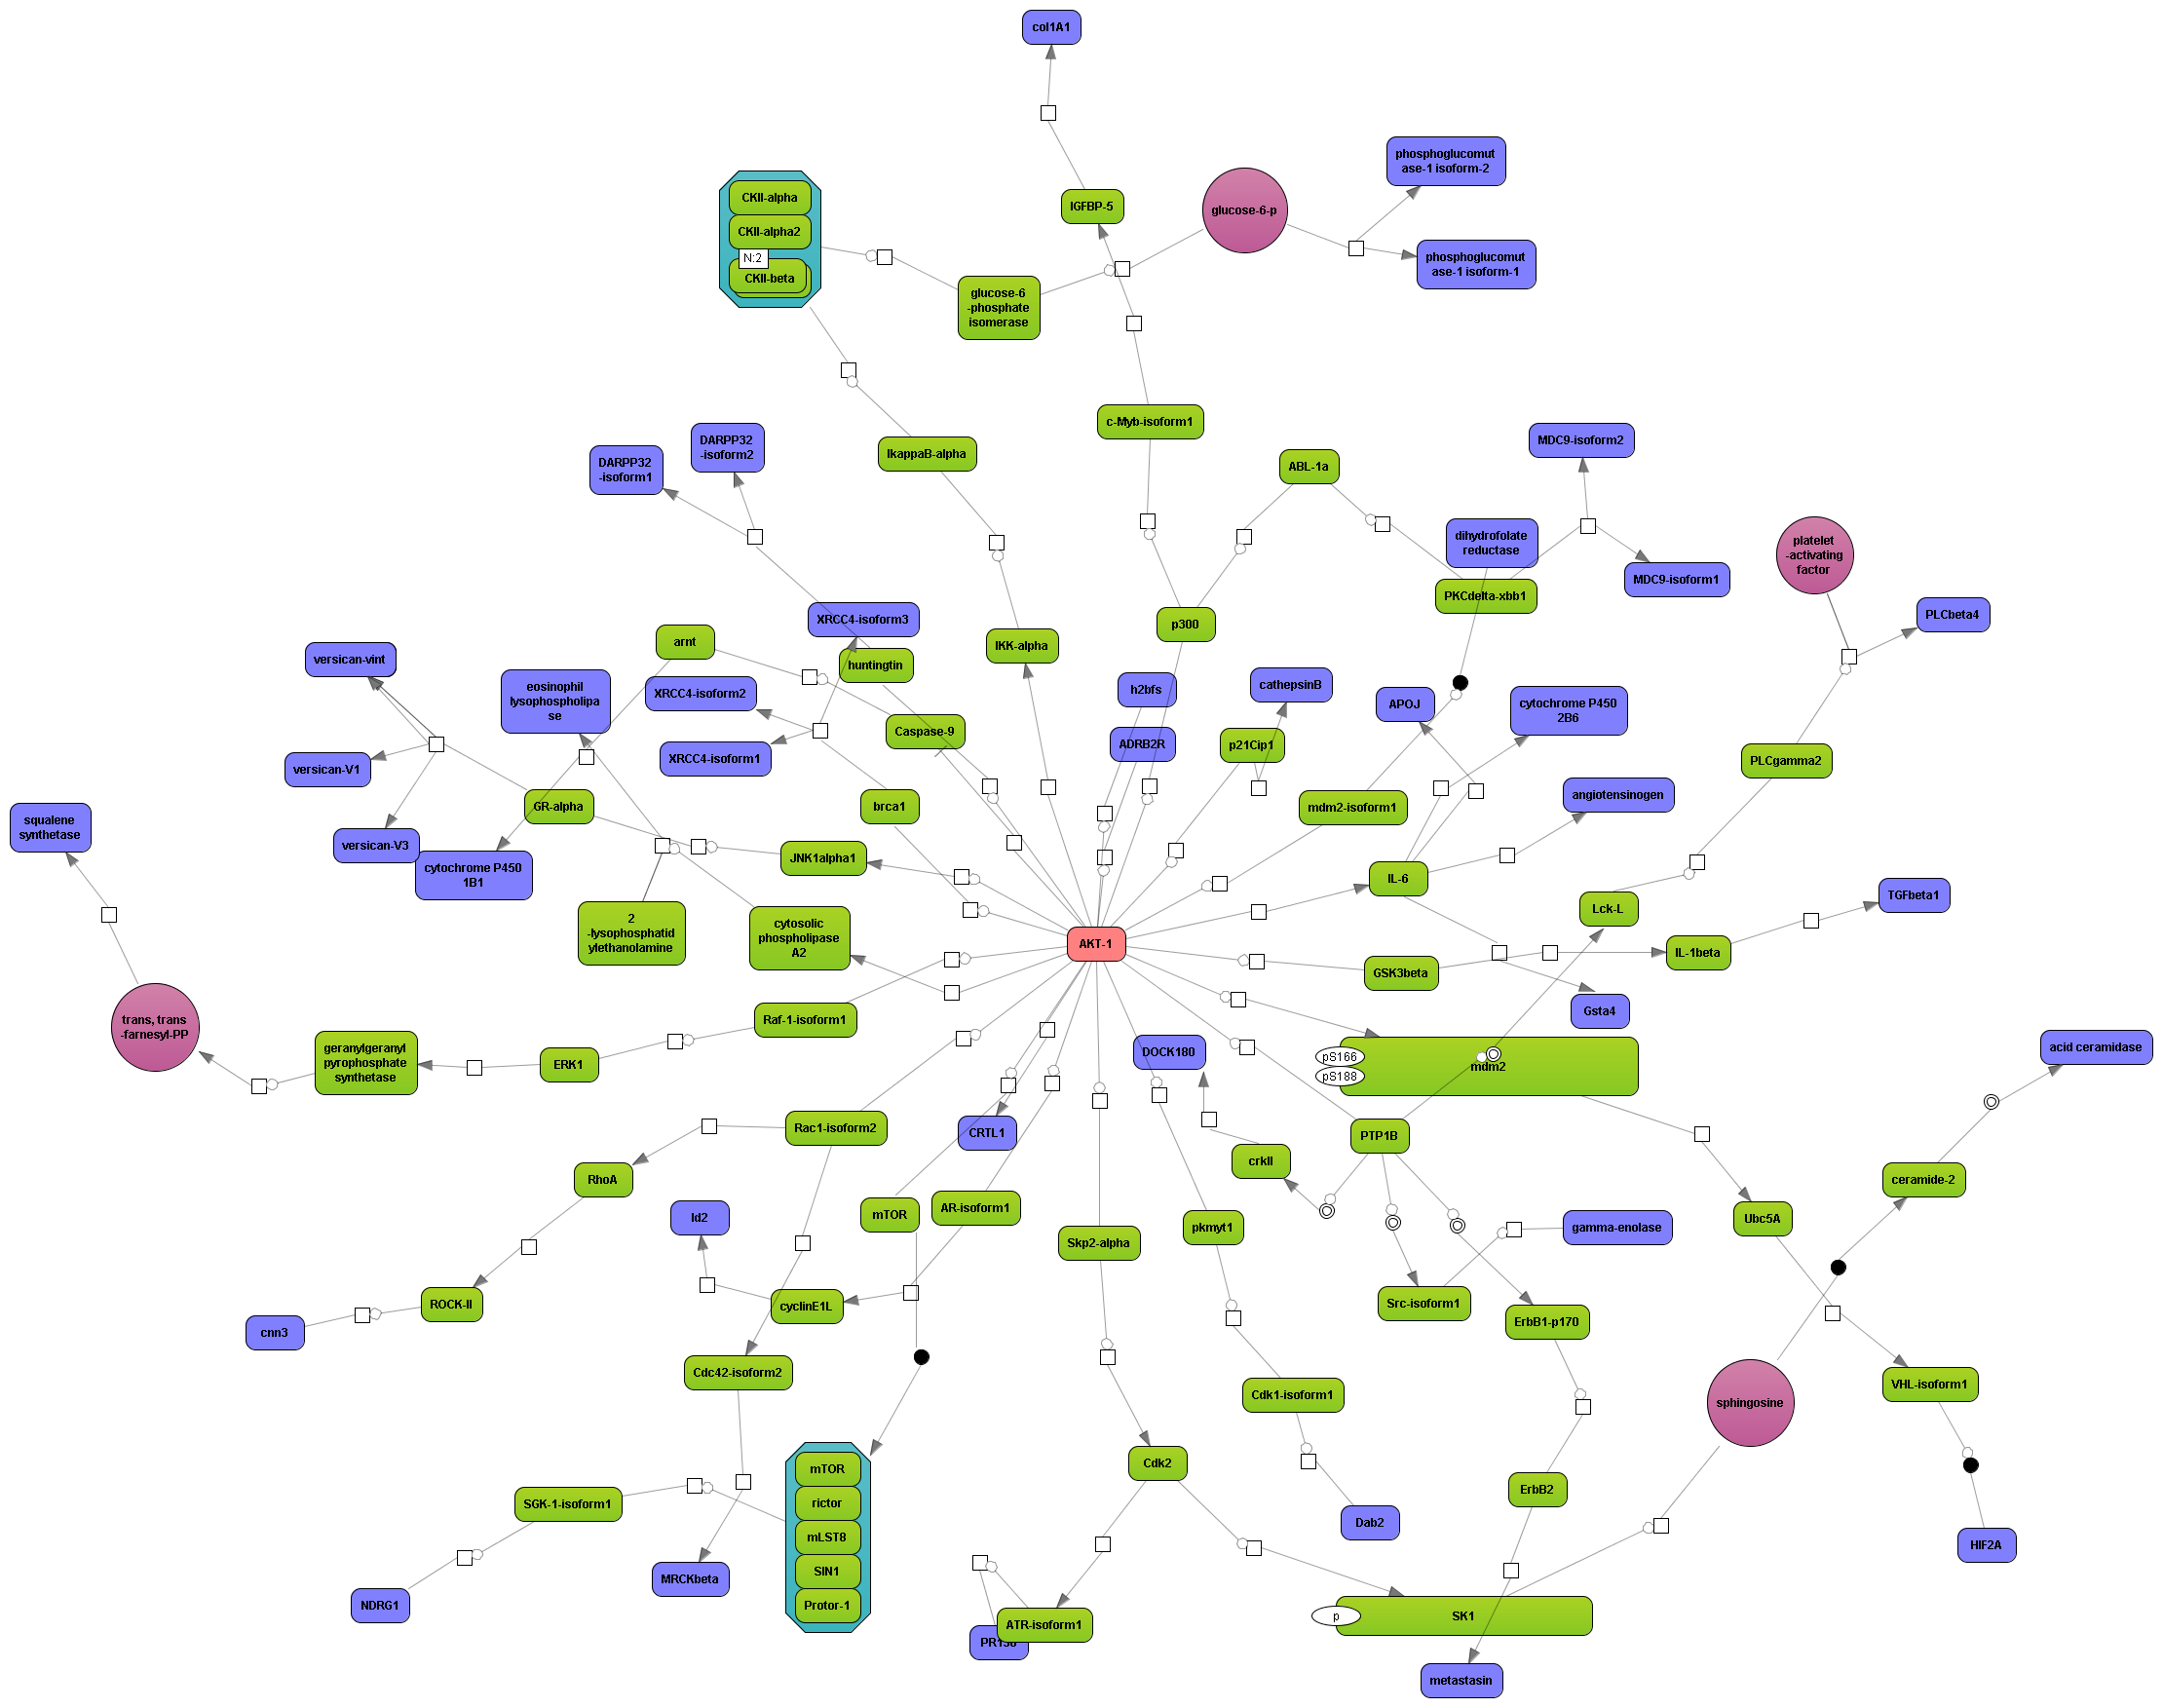
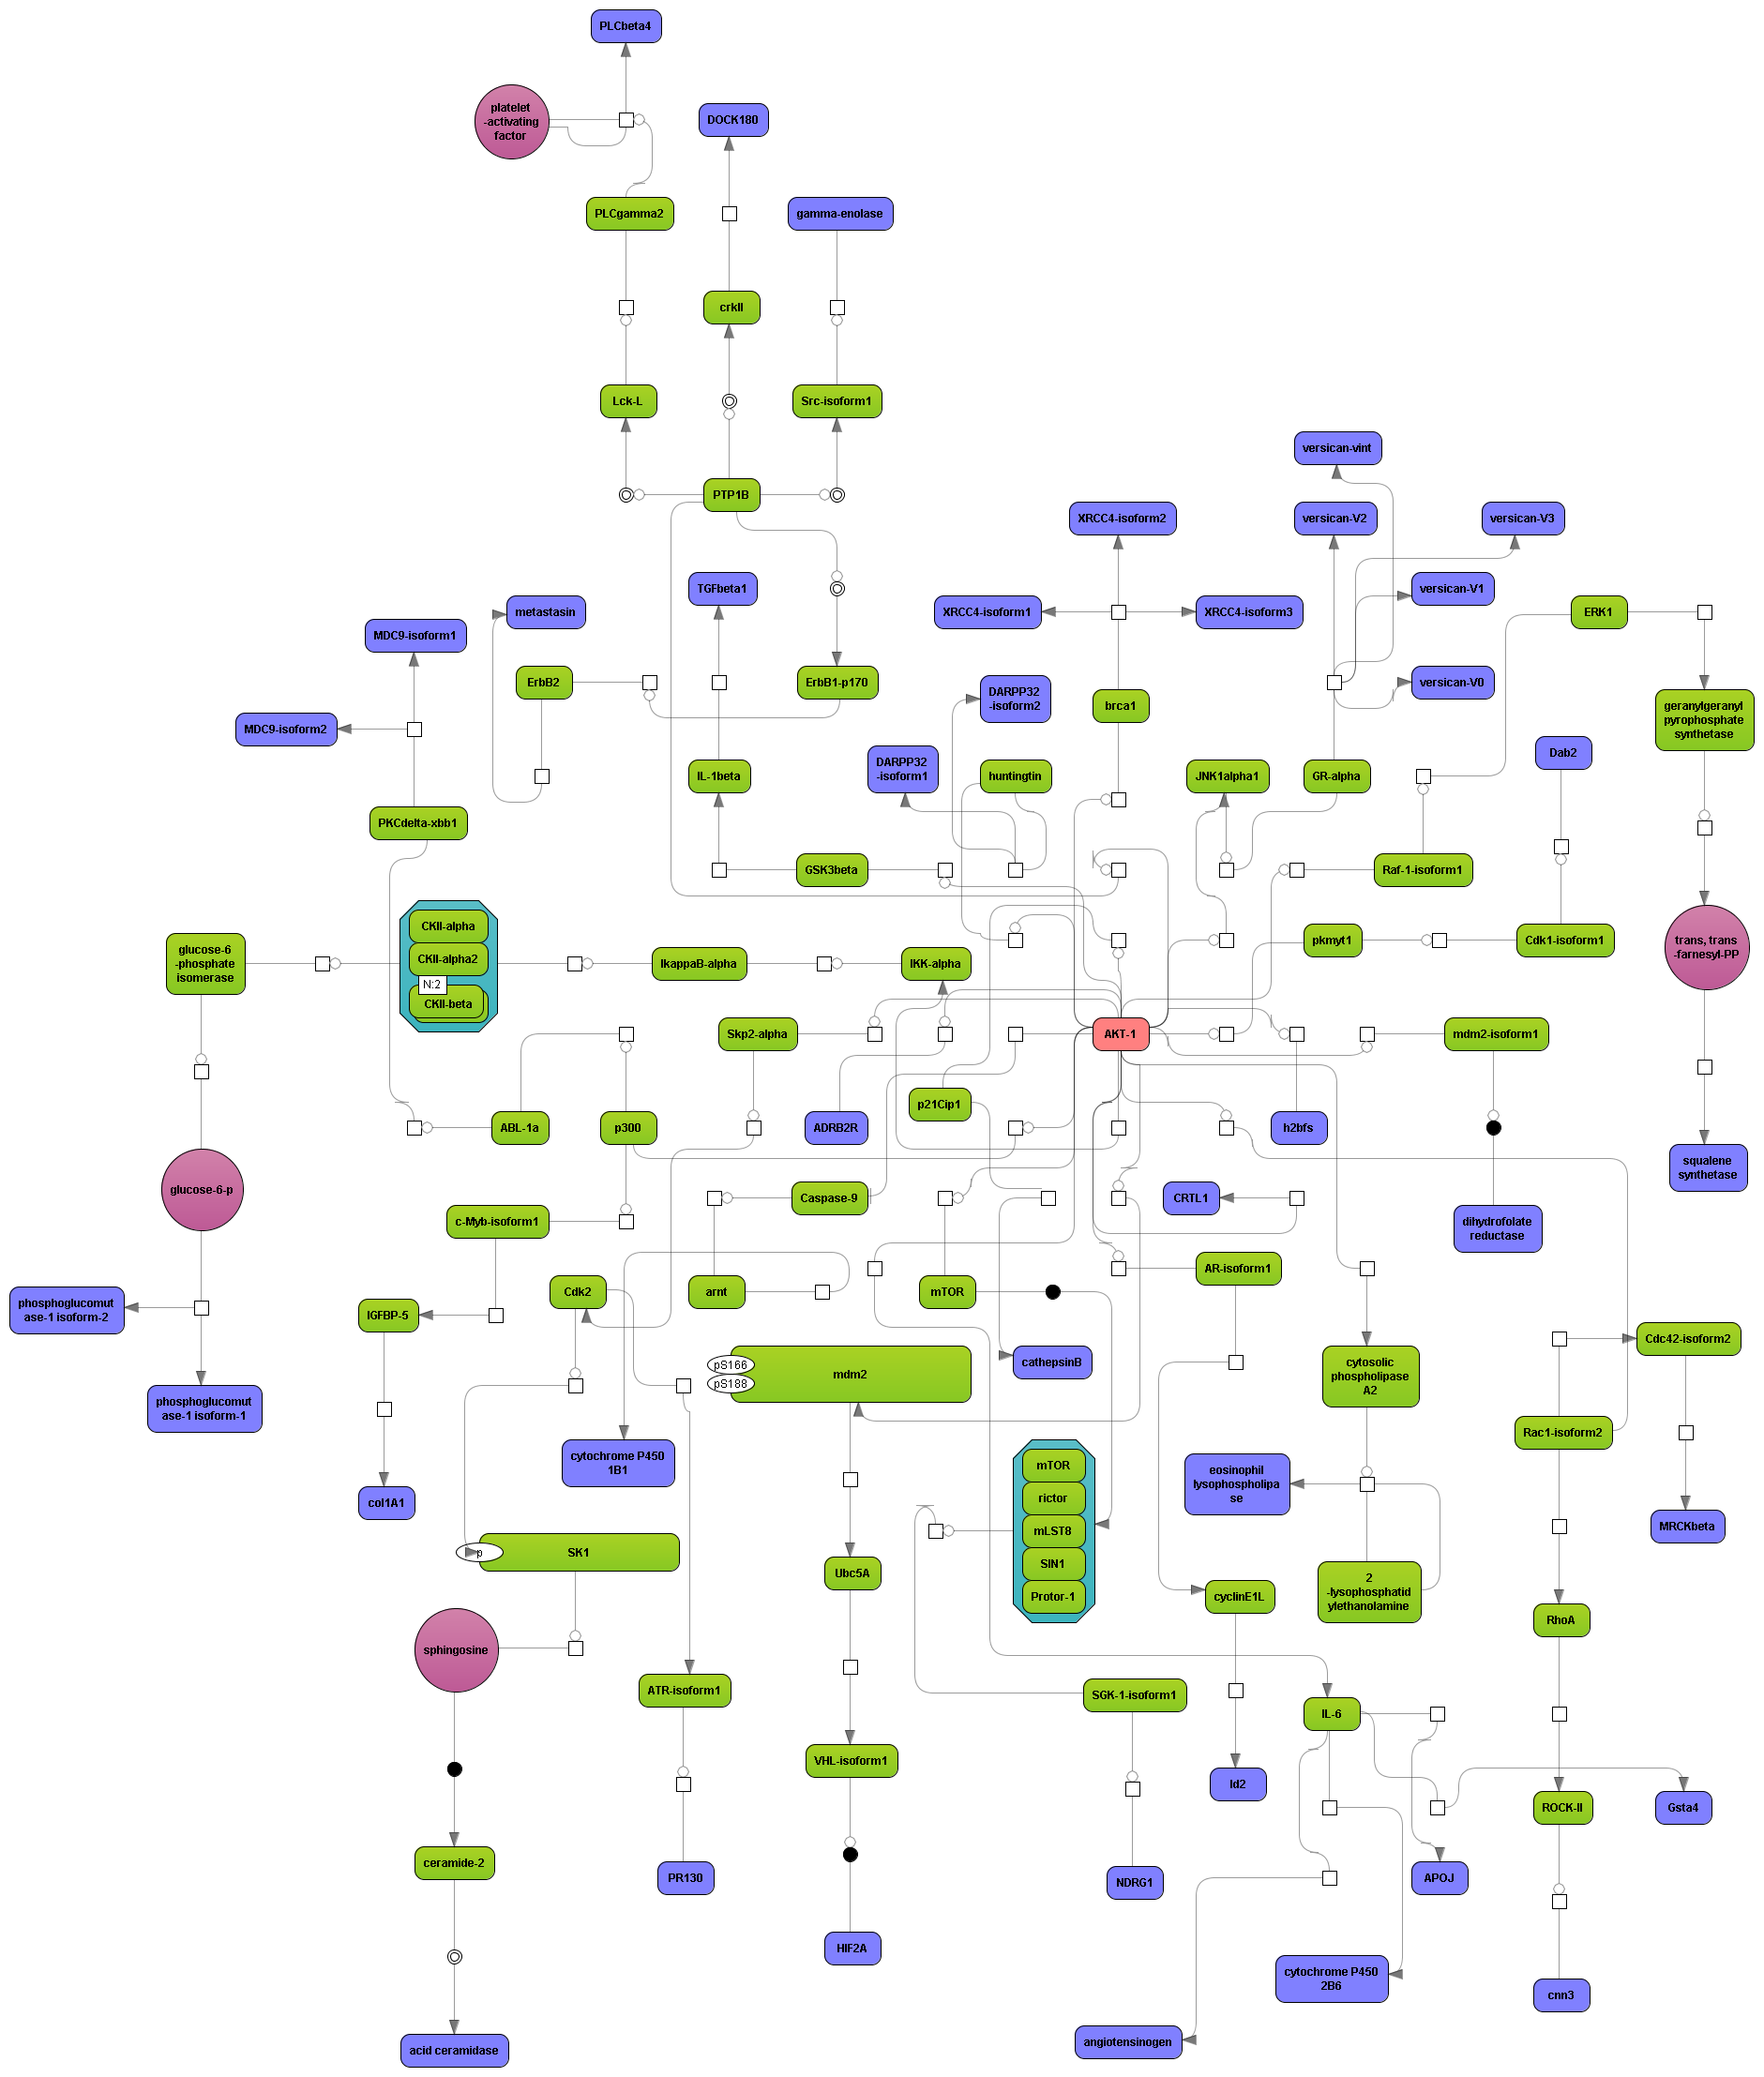
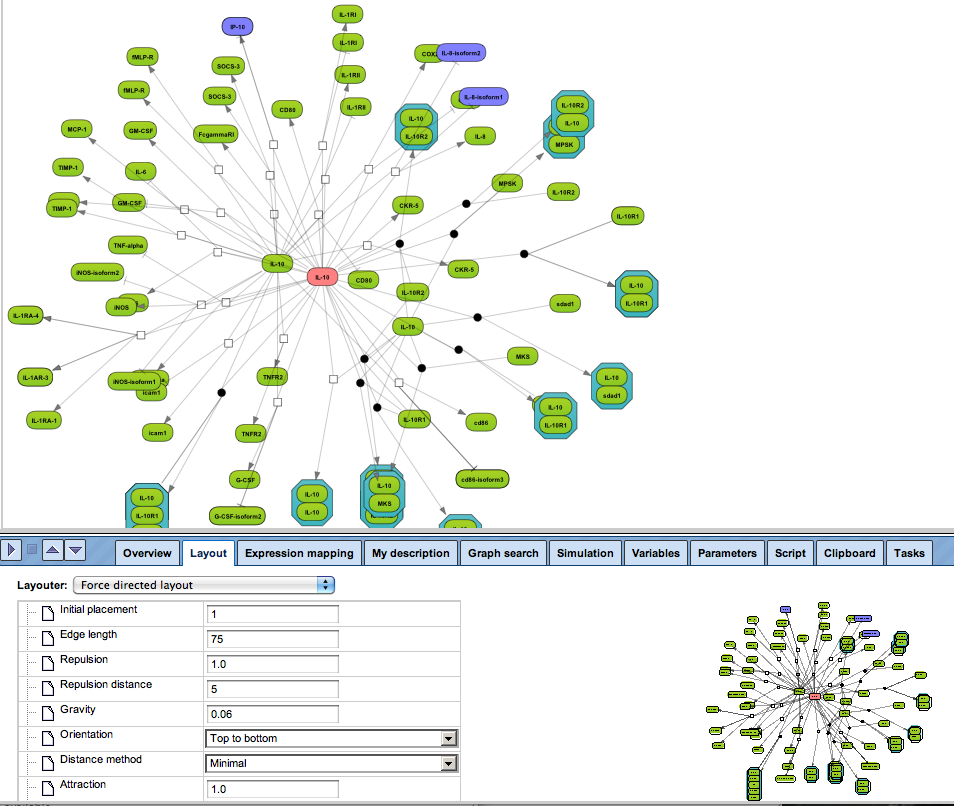
Enjoy variable layout, expansion and joining functions.

Visualize your network according to internationally accepted SBGN standards (Systems Biology Graphical Notation).

Benefit from high-quality and flexible export routines for your publications.

×